These Signs Are Bad for U.S. Economy
The three economic indicators I will tell you about below have me very worried about the U.S. economy. Collectively, these three time-proven indicators of what will happen to an economy six to 12 months down the road indicate that there’s a recession ahead.
Scary Economic Indicator #1
Let’s start with the simple industrial production indicator. Manufacturing is a great indicator for economic activity. If the indicator rises, it suggests that there is growth ahead. If the indicator declines, it suggests that a recession is ahead.
Advertisement

Please look at the table below related to the U.S. economy. It shows the year-over-year percentage change in the Industrial Production Index (IPI) tracked by the U.S. Federal Reserve.
Also Read: Stock Market Crash 2017? This Could Trigger a Stock Market Collapse
The trend in the above table clearly shows that industrial production in the U.S. economy has contracted for two consecutive years. And 2017 didn’t start on stronger ground either; I’m expecting another decline in industrial production for this year.
Scary Economic Indicator #2
Next, inventories at businesses are rising. It’s a red flag when inventories are rising while sales are stagnant or declining.
The chart below shows the inventories-to-sales ratio in the United States.
|
Year |
YOY % Change in Industrial Production Index |
|
2010 |
5.57% |
| 2011 |
3.09% |
|
2012 |
2.9% |
| 2013 |
2.0% |
|
2014 |
3.1% |
| 2015 |
-0.7% |
| 2016 |
-1.2% |
(Source: “Industrial Production: Total index,” Federal Reserve Bank of St. Louis, last accessed April 20, 2017.)
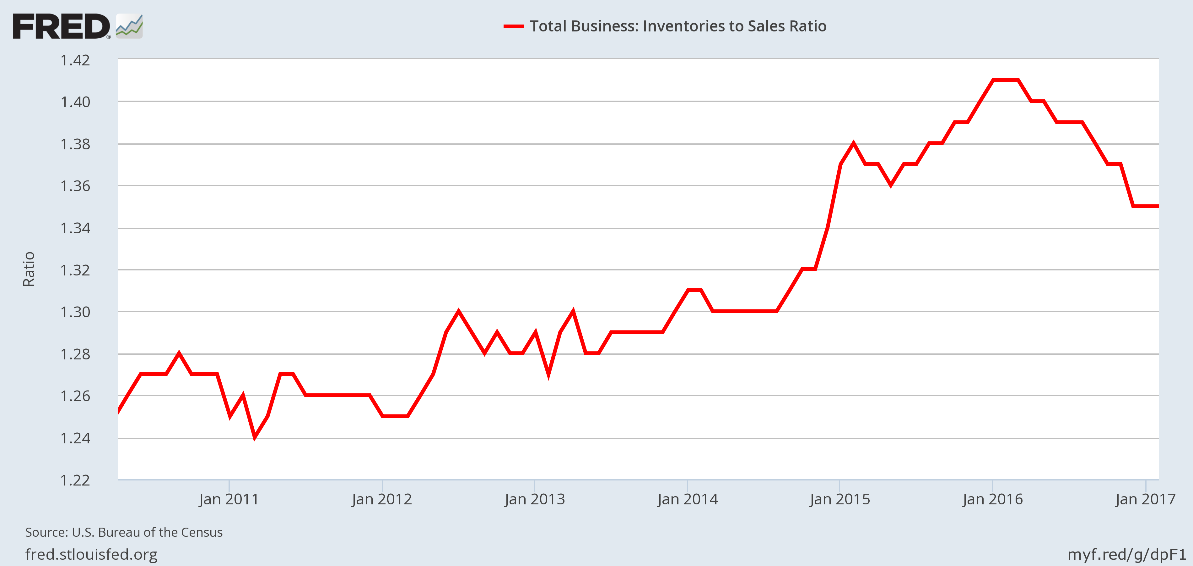
(Source: “Total Business: Inventories to Sales Ratio,” Federal Reserve Bank of St. Louis, last accessed April 20, 2017.)
The above chart means that the inventories that businesses are stockpiling (goods they have on their shelves or in their warehouses) are rising. This is a problem because businesses only make money when they sell their products, not when they store them.
Scary Economic Indicator #3
Finally, consumer spending (even adjusted for inflation) has been declining since early 2015. Consumer spending (also referred to as personal consumption expenditures) is the biggest part of U.S. gross domestic product (GDP). In fact, consumer spending makes up about two-thirds of our GDP.
The chart below shows the year-over-year percentage change in monthly real personal consumption expenditures (consumer spending adjusted for prices).
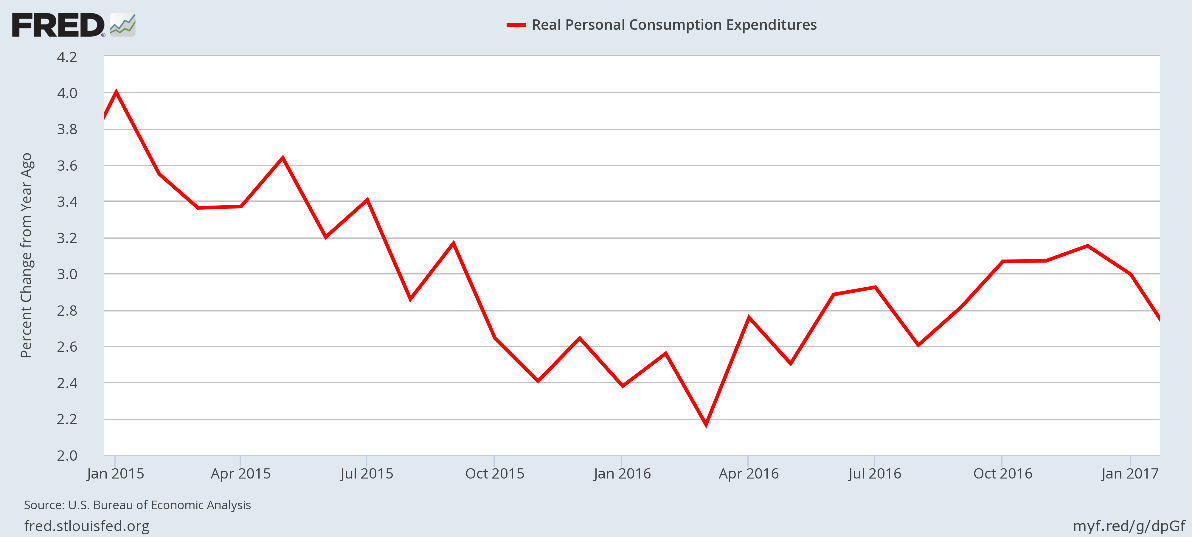
(Source: “Real Personal Consumption Expenditures,” Federal Reserve Bank of St. Louis, last accessed April 20, 2017.)
As the chart shows, over the past two years, consumer spending has been low.
Stock Market Not the Right Place to Look
It can’t be stressed enough: if investors are looking at the stock market as an indicator of how well the U.S. economy is doing, they are looking in the wrong place. Euphoria is only hitting the stock markets, nothing else.
The fundamentals of the economy are deteriorating, not improving, in an environment where the Fed is raising interest rates. This does not bode well for the future of the U.S. economy or the stock market.