Hindenburg Omen Chart Analysis 2017
The Hindenburg Omen tracker is an important signal. It results from a financial technique that consists of forecasting a stock market crash based on technical analysis. The Hindenburg Omen can only occur in a rising or bull market. It has been known to warn of a major crash. Sometimes, it produces a false rally, followed by a crash.
Either way, for those who value technical stock analysis, the Hindenburg Omen chart 2017 speaks clearly. It’s saying—better make that screaming—that a market crash is imminent. What is the Hindenburg Omen calculator, or simply the Hindenburg Omen? As you may have guessed, this technical chart signal is named after the German airship, “LZ 129 Hindenburg,” which crashed in New Jersey in 1937 upon landing.
Advertisement

Also Read: Stock Market Crash 2017? This Could Trigger a Stock Market Collapse
It didn’t just crash. It went down in flames as the hydrogen gas used to make it fly caught fire. The analogy should send chills. A chart suggesting a Hindenburg Omen is predicting an especially bad crash. It’s the kind of market collapse that literally burns your savings and investments.
The Hindenburg Omen clearly appeals to technical chart analysts. For one to be observed, there must occur technical indications from the lack of a market-wide upward movement. The traditional definition is quite complex and includes multiple criteria, with the main one being that the daily number of fresh 52-week highs and 52-week lows on the NYSE must exceed 2.2% (some argue 2.8%) on the NYSE-traded values on the same day. Mathematician Jim Miekka came up with the concept.
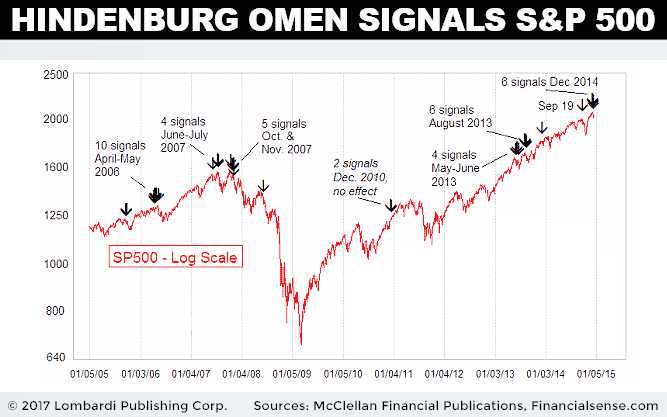
The Hindenburg Omen statistics are scary. The indicator is said to have predicted every major stock market crash since Black Monday (October 19, 1987). The S&P 500 dropped 1.6% in the week after the appearance of the Hindenburg Omen in November 2007, followed by a 2.3% decline in the following week. One year later, we all know what happened…the drop was 40%.
A stable market shows a certain degree of uniformity and even predictability in stock valuations. But an overly volatile market will tend to produce unexpected fluctuations among some of the top stocks, and all at the same time. This divergence produces the Hindenburg Omen.
But, there’s a catch. The Hindenburg Omen only becomes “official” when it reappears within 36 days. It’s not always right, but just about all crashes observed since 1987 have had one. So, causality is not scientifically proven. Being alert and cautious might be boring from the risk perspective, but it does allow for fewer episodes of insomnia at night.
Be Vigilant, This Hindenburg Omen Makes Sense
Consider that the Hindenburg Omen warnings have coincided with mounting political problems in Washington. The media has assailed President Trump, leaving ever more political instability in Washington. That alone should be enough to bring down the market today. Six months into the presidency, Trump’s promises and hopes have fallen flat. Nothing works.
There have been scandals—or the media has made them up to be as such—that Trump appears stuck. He can’t make a single move, let alone launch the biggest tax reform in the history of income tax. After all, that’s what has driven the bull market since last November. Not a week passes without someone leaving the White House—the latest being strategist Steve Bannon. The American house is divided. As a wise man named Lincoln once said in 1858, it cannot stand as such.
Some dismiss the Hindenburg Omen’s ability to predict a market crash. But, when investors put technical analysis against the overall macro reality, they should have a few second thoughts about that next stock purchase. (Source: “The Hindenburg Omen??? A technical analyst breaks down the signs,” Barron’s, August 17, 2017.)
There’s no escaping the conclusion that the market correction many—including some of international finance’s top dogs like Ray Dalio—have been expecting is looking likely. Add to that the solar eclipse of August 21 and there you have it! A healthy dose of superstition can play a role in investing decisions, if not reality.
Many experts will warn that the Hindenburg Omen is not a reliable indicator. They say it’s often a false alarm. That may be, but then again, what is a reliable forecast? Why do so many investors always get caught up in market crashes? Reliable or not, the fact that this indicator is occurring just as the overall picture—the framework, if you will—urges caution from all ends makes this occurrence of the Hindenburg Omen an important one. At the very least, you should be more alert than usual.
Even if the current price losses at first glance seem to fit well with the numerous Hindenburg Omens, investors should consider one thing. The Hindenburg Omen likes to unleash its full effect with a certain time delay. The negative signals from Wall Street also cause price losses on the stock exchanges in Europe. So, there’s no escaping the Omen. The latest Trump episodes, the fact he’s not being allowed to carry out his mandate, and continuous terrorist attacks (the latest being Barcelona) are also making investors insecure.