Technical Analysis Suggest U.S. Dollar Could Drop in 2018
Basic economics: When interest rates increase, the currency appreciates in value. Some may be thinking this could be true for the U.S. dollar, as the Federal Reserve is raising rates. Sadly, this may not be the case.
Here’s why…
Advertisement

If you look at the U.S. dollar charts, they suggest there’s a lot of bearish sentiment toward the greenback.
Look at the long-term chart of the U.S. dollar index below. The index essentially tracks the performance of the dollar relative to other major currencies.
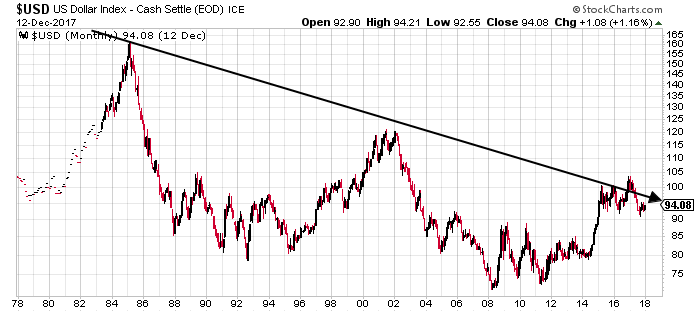
Chart courtesy of StockCharts.com
For the last 35 years, the U.S. dollar has been trending downward relative to major currencies. With this, remember the most basic rule of technical analysis: The trend is your friend until it’s broken. If you look at the dollar price action between 2016 and now, the greenback made an attempt to break above the trend but it failed.
So, the path of least resistance remains downward on the U.S. dollar. Going against the trend could be a big mistake.
Shorter-Term Charts Say Bearish Sentiment Prevails
Look at the shorter-term chart below. At the bottom of the chart, a momentum indicator called the moving average convergence/divergence (MACD) is plotted.
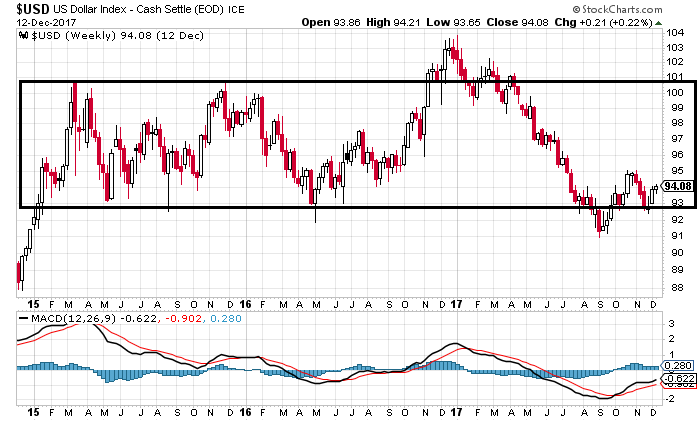
Chart courtesy of StockCharts.com
Since 2015, the U.S. dollar index has remained relatively flat. It ranged between 93 and 101. As this was happening, the MACD was trending lower.
Understand that when the MACD trends lower and is in negative territory, it suggests that sellers are coming in. And whenever this sort of divergence happens, where the MACD is trending lower and the price is trending higher or staying flat, a downward move follows.
Will it be the case for the dollar as well? It’s possible.
Look at the even-shorter-term chart below.
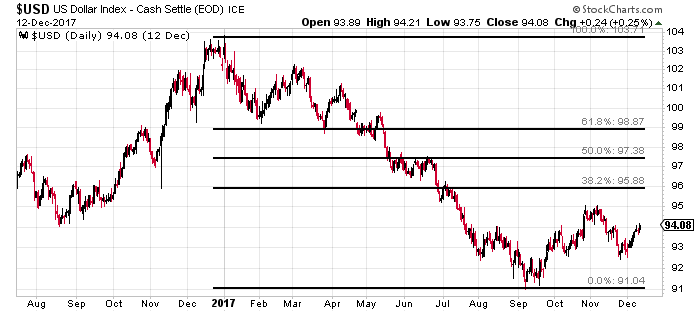
Chart courtesy of StockCharts.com
On the chart above, a technical analysis indicator called the Fibonacci retracement has been plotted (the black lines). At its core, this indicator tells where the next resistance level could be. Usually, the 38%, 50%, and 62% retracement levels are used by technical analysts as possible resistance levels.
The U.S. dollar hasn’t even been able to make it to the 38% level after making a low in early October. This says bearish sentiment is prevailing.
U.S. Dollar Outlook for 2018 & Beyond; More Pain Ahead for the Greenback
Dear reader, looking at the charts, I am not too optimistic about the U.S. dollar going forward. If the long-term trend persists and the sellers remain dominant, it wouldn’t be shocking to see the greenback drop to 2014 lows in 2018—the dollar index could drop as low as 80. That’s 15% below where it currently sits.
Keep in mind, if the dollar declines in value, assets like gold could rise significantly in value.
What would change my outlook? If the U.S. dollar index suddenly makes a move above 103. If that happens, it would mean the long-term trend has been broken and there could be an uptrend in the making.