These 3 Charts Say Stock Market Crash Looming
Looking at the price action on the key stock indices, one could be convinced that a stock market crash isn’t possible. Don’t be lured by it. 2017 could be the year when stocks face severe losses.
Before going into any details, remember one thing: the best time to buy is when there’s blood in the street. And be fearful when everyone is rushing to buy. When everyone is rushing to buy, you see irrationality come in, and bubbles are formed.
Advertisement

Dear reader, look back at any stock market crash, and you will find one thing in common. Stocks reported severe losses after a period of extreme optimism. In other words, you had a run-up based on nothing but optimism, and then reality kicked in.
As it stands, we are seeing that investors are largely in favor of owning stocks. This should scare you, to say the least.
Look at the chart below, and pay close attention to the circled areas;
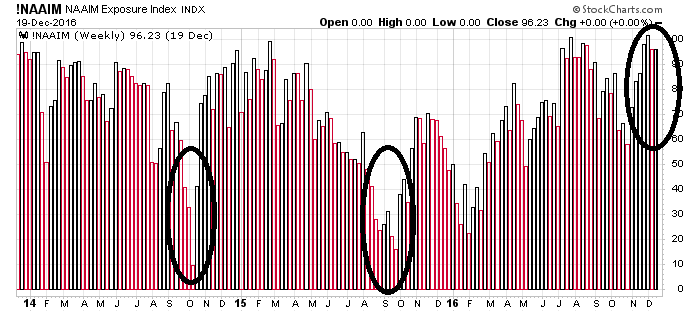
Chart courtesy of StockCharts.com
At its very core, the chart above shows the National Association of Active Investment Managers’ (NAAIM) Exposure Index. It shows the average exposure that active investors have in their portfolios to U.S. stocks.
For the last two years, between September and December, active investment managers’ portfolios made up just about 50% of U.S. stocks. This year, it’s close to 100%. Don’t take it lightly.
The NAAIM Exposure Index is saying that the deep-pocketed investors are optimistic on stocks. This could be an indicator of a stock market crash ahead.
If this wasn’t enough, look at another chart below that screams that there’s severe optimism, and that a stock market crash could be ahead.
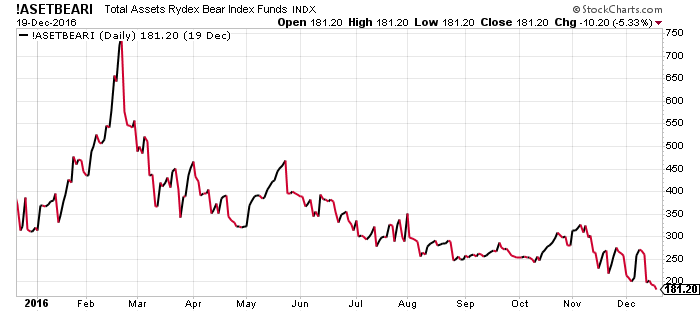
Chart courtesy of StockCharts.com
The chart above essentially shows how many assets are in funds that bet that a stock market crash could occur. It tells investors’ sentiment more than anything; as assets in bear stock funds increase, it means investors are turning bearish. If the assets decline, it means investors are turning bullish.
Since early 2016, assets in these funds have declined close to 75%. This says that investors’ optimism is severely bullish.
Lastly, pay attention to the Chicago Board Options Exchange (CBOE) Volatility Index (VIX); it’s also referred to as the “Fear Index.”
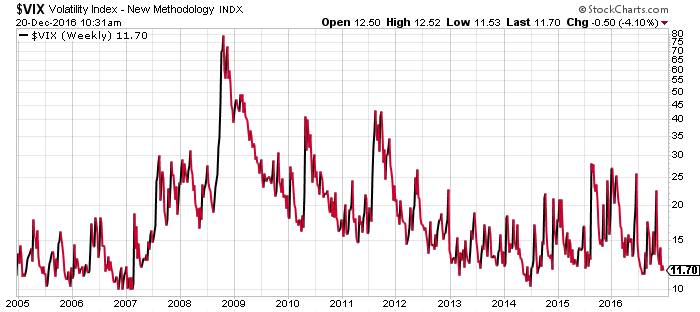
Chart courtesy of StockCharts.com
Looking at the chart above, it seems as if investors are anything but fearful. The VIX currently sits at one of the lowest levels since 2007, just before the stock market crash of 2008–2009.
If You Hold Stocks, Be Careful…
Looking at all this, I reiterate, don’t get lured by key stock indices hitting all-time highs. Investors should be questioning the fundamental data; is it moving in favor of a higher stock market? As I see it, this is not the case.
Understand that the best opportunities are born in times when no one is looking to buy. The 2008–2009 stock market crash was a prime example of this.
When stock markets are at their all-time highs, the returns are not very substantial. In fact, the risks of a sell-off increase.
What could an investor do? Know that irrationality can run for long time, but not forever. One thing that investors could do is have a stop-loss in place. In case there’s a stock market crash, they don’t suffer severe losses to their portfolios.