QQQ Stock: Beware of Bearish Patterns
2016 has been one wild roller coaster of a year. The year started off dismal, as instruments such as PowerShares QQQ Trust, Series 1 (ETF) (NASDAQ:QQQ) stock and iShares Russell 2000 Index (ETF) (NYSEArca:IWM) stock participated in a broad-based market sell-off. Many pundits and analysts claimed that this event marked the beginning of a bear market, but now, as the theme of 2016 dawns upon me, 2016 was the year everybody got it wrong.
The media and pundits made us all believe that Brexit would cause the stock markets to crash, but after a couple days of selling, cooler heads prevailed and new highs were soon upon us. These same sources also had led us to believe that if Donald Trump were to win the presidential election, this too would cause the stock markets to crash. Once again, they were wrong, and this time, only a few hours of selling occurred before cooler heads prevailed. These cooler heads sent the equity markets soaring, breaking numerous records in the process.
Advertisement

I am starting to wonder if voters are actually choosing the most toxic option that the media and pundits tell them will cause the most damage. Regardless, the stock market continues to shrug off any type of bad news, and it continues to defy gravity as new all-time highs are continuously being forged.
I am now trying to make heads or tails of the situation that is at hand, and as a result, I have come across two stock charts that have sent chills down my spine. These chills are because these two charts are indicating that a topping pattern is potentially being painted. These charts may have indicated that the music may have stopped, but the party-goers have failed to realize it yet.
The first chart is the iShares Russell 2000 (ETF), and it follows the Russell 2000 index, which is the 2,000 smallest-cap components of the Russell 3000 index, and is the most common benchmark for “small-cap” stocks.
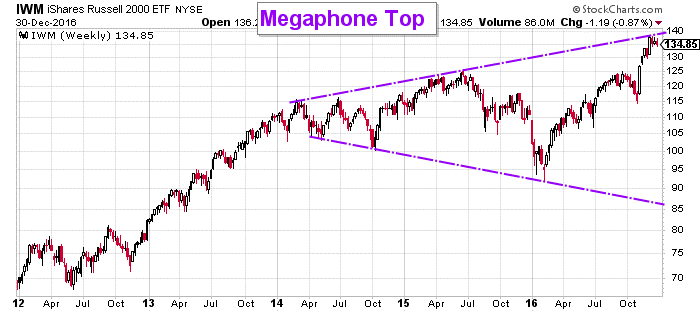
Chart courtesy of StockCharts.com
The bearish pattern that is illustrated above is referred to as a “megaphone top” or a “broadening top.” For those familiar with technical patterns, it is the complete opposite of a symmetrical triangle. There are two expanding trend lines that make up this pattern. Each and every time price has met a trend line, it has caused the trend to reverse. This new trend continues until the next trend line has been met. Higher highs and lower lows define this pattern.
The logical price objective for IWM stock would be for it to trade lower until support is met, outlined by the trend line. It currently sits at $86.00 and would represent a 36% decline for IWM stock from current levels. The problem is, as time progresses, support suggested by the trend line continues to decline, which compounds the bearishness.
The second chart is PowerShares QQQ Trust, Series 1 (ETF), and it follows the NASDAQ 100 index, which is the 100 largest components by market cap that make up the NASDAQ index. The NASDAQ index is the benchmark for “technology” stocks.
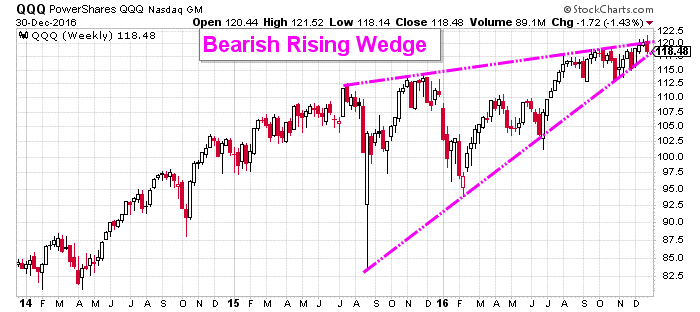
Chart courtesy of StockCharts.com
The bearish pattern that is illustrated above is referred to as a bearish rising wedge. This pattern consists of two converging trend lines that are both sloped upwards.
What makes this pattern bearish is that, on average, it breaks below the lower trend line that acts as support and the initial price objective is the point from which the wedge began to form. In this instance, it suggests that a break below support would target the low that was created in August 2015 at $83.35. From current levels, that represents a 29.65% decline for QQQ stock.
When the most common small-cap benchmark exchange-traded fund starts to paint a bearish pattern, it definitely has my attention. If this index was the only one suggesting a bearish outcome, I could perhaps dismiss it, but the NASDAQ 100 ETF is also painting a bearish picture, so I must pay heed, especially when the potential price objectives are way beyond the scope of the recent corrections that have gripped this endless bull market.
Final Words
In this upside-down world we live in, it is always proper to question everything, and that includes the current record run in stocks. So when the IWM stock chart suggests that a top is forming, it could be a one-off, but when the QQQ stock chart starts painting a similar bearish picture, it is always wise to pay heed. It is my belief that a substantial sell-off in equities is looming, and the percentage drops suggested by the two ETFs is the definition of a crash.