
Resumption of the Bull in Gold Prices
There are increasing indications that the sell-off experienced in gold following the presidential election has run its course. These same indications are suggesting that the gold price rally is set to ensue. These indications come in the form of bullish price action and a trading signal that can be found and generated on the gold price chart.
Using a price chart as the basis of an investment view is a style of research known as technical analysis. The technical analysis method uses historical price and volume data to discern trends and forecast future prices. New developments in behavioral finance support this ancient view of investment analysis, and many investors have found great success in applying this method in creating disciplined trading strategies.
Advertisement

In our previous publication, “Perfect Ingredients for a U.S. Dollar Crash,” we outlined that the U.S. dollar sits in a precarious situation that can potentially set off a significant selling event, which will drive the value of the U.S. dollar lower. Gold prices and the U.S. dollar are inversely related, and any weakness in the U.S. dollar should translate into gold price strength.
Couple the fundamental backdrop of a weakening U.S. dollar and a technical backdrop that supports higher gold prices, and these factors add credence to the notion that higher gold prices is a likely outcome. Perhaps the media outlets and pundits who suggested that gold will act as a safe haven with Donald Trump in power will finally be able to save face.
The following price chart illustrates the technical pattern which suggests that a higher gold price is likely.
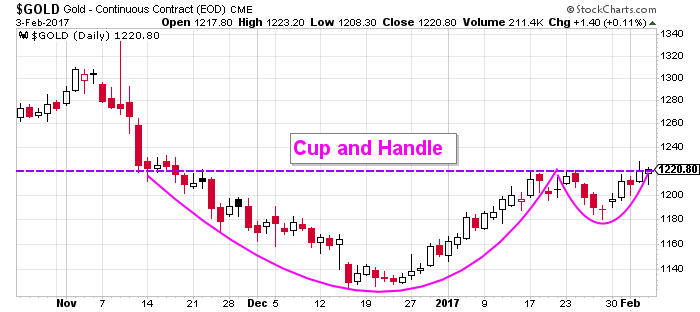
Chart courtesy of StockCharts.com
In the aftermath of the U.S. presidential election, in which a sell-off gripped the price of gold and drove it lower, a clear and concise technical pattern known as a “cup and handle” pattern has developed. The name of this pattern is straightforward, in that it describes the shape that this pattern produces.
The theory behind the cup and handle pattern is that once the price closes above the horizontal resistance level at $1,220.00, which has contained the gold price, a rally will ensue. This same theory also states that the cup and handle pattern can be used to produce a potential price objective. This gold price objective is obtained by taking the depth of the “cup” and extrapolating it above the level of resistance that had contained price.
Based on this notion, a completed cup and handle pattern produces a preliminary potential gold price objective of $1,310.00.
The following gold price chart illustrates a newly generated signal that supports the notion that higher gold prices are likely.
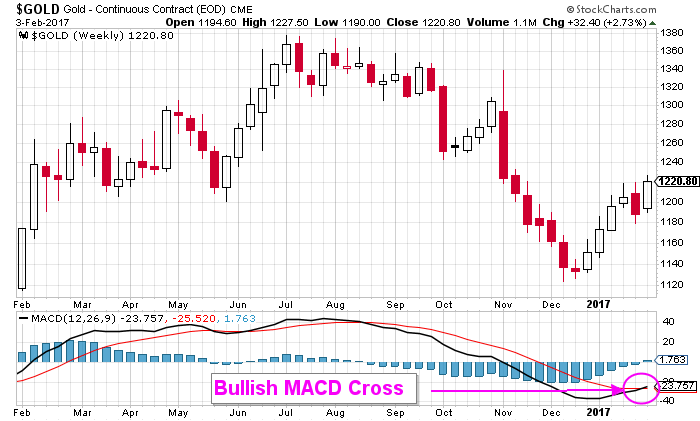
Chart courtesy of StockCharts.com
The gold price chart above illustrates that the moving average convergence/divergence (MACD) indicator in the lower panel has just crossed in a bullish manner. MACD is a simple, yet effective, trend-following momentum indicator. This indicator uses signal-line crossings to distinguish between bullish and bearish momentum signals.
The bullish cross indicates that bullish momentum has once again overwhelmed any bearish momentum and, as a result, the path of least resistance is toward higher prices. With this indicator engaged in a bullish manner, it suggests to traders that trading positions are best suited with a bullish bias geared towards a higher gold price.
The cup and handle pattern and the MACD indicator act in tandem to suggest and support the notion that higher gold prices are a likely outcome. The information that these indicators provide can be used to create an effective strategic trading strategy.
Bottom Line on the Gold Price
The price action and signals generated from the gold price chart suggest that higher gold prices are a likely outcome, and this supports the notion that holding a bullish view on the price of gold is warranted at this time.