Is Gold Resuming Its Status as a Safe Haven?
Investors are still living the party. The stock indexes remain at their record peaks and the Dow Jones shows no signs of letting down. Yet, there is an insidious sign that equities and their seeming incapability of falling in price are causing many to feel exhausted or even downright afraid.
The idea of speculation itself has started to wane. More than encouraging, the success of cryptocurrencies in the last few months of 2017 may have prompted a period of reflection, which explains the course of the gold price for the last two years.
Advertisement

Based on recent gold price history and the start of a crypto market crash, the market has reached a turning point.
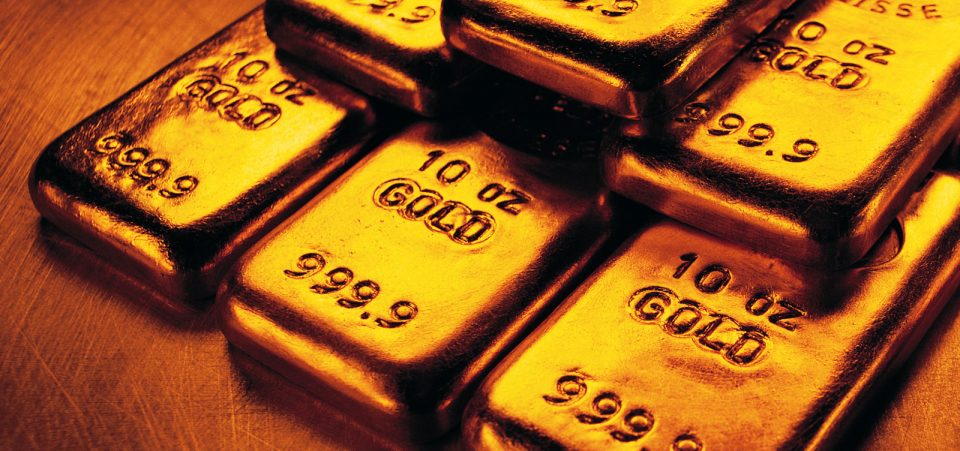
Gold prices in 2018 are performing much better than anyone had expected. Many analysts saw gold as going down in the first half of the year, with sentiment turning bullish only in the latter part of the year and then gradually increasing to hit $1,375 in 2019 or so. (Source: “Goldman Sachs Sees $1,375 Gold At End Of 2019,” Kitco Metals Inc., October 26, 2017.)
How could seasoned analysts get it so wrong? Gold prices are hovering around the $1,350 mark already. This is no accident. We may be looking at a reversal of investor attitude. Even the markets themselves have entered a period of limbo.
After making big gains with almost daily frequency, all of the big indexes from the S&P to the NASDAQ and the Dow Jones have slowed down. Are they merely catching their breath after record runs? Or have many investors started to notice that the recent records have feet of clay? The gold price chart suggests that many are returning to safety.
Gold Price Chart in Last 17 Months
What is so special about the last 17 months in gold prices? As it happens, the gold chart since August 2016 shows a clear pattern of rebound. Prices dropped to a five-year low in December 2016. The U.S. election and President Donald Trump’s tax reform promises muddied the gold markets in favor of equities.

Chart courtesy of StockCharts.com
Many were all too happy to joke about Trump, but few, Democrat or Republican alike, have dismissed their feelings and political orientations to score big gains. Trump was always going to be unpredictable. The Dow Jones records made many forget. The president has conducted everything but an isolationist policy. Risks of military and trade wars are far higher than anyone had expected.
The bird’s-eye view suggests that a financial crash is inevitable and that gold will be one of the big favorable stories of 2018. Cryptocurrencies appeared to be taking a place alongside gold, becoming another security blanket against the vagaries of the market. But they took an even wilder direction just before the end of 2017.
After all, when something increases some 15-times in value—as has Bitcoin—something is odd. Bitcoin is not unique. Other cryptocurrencies have followed the same dangerous pattern. Indeed, there is an overall tendency to overprice and speculate over everything now, and not just in the financial markets or in the new—correctly identified as “cryptic”—investment solutions.
How else would anyone explain in reasonable language that a painting sold for some $450.0 million at a Christie’s auction in November? True, the painting was Leonardo da Vinci’s “Salvator Mundi,” but it broke a previous record of $300.0 million for a painting. This is indicative less of confidence and more of irrationality. Realistically, how much more would Leonardo’s painting fetch the next time it goes on sale? What if it’s false?
No economic period has proven to be impervious to risk or cycles. The markets have experienced one of the longest favorable streaks ever. Common sense urges us to consider that a correction is inevitable. After all, the markets themselves are demanding it. Many, however, are thinking that the next correction could easily turn into a financial disaster.
As for the U.S. dollar, there are gloomy signs on that front as well. China, which owns one of the highest amounts of U.S. debt, has revised the U.S. credit rating downward. While everyone was rightly worried about the crash of Bitcoin in mid-January, Dagong Global Credit Rating Co., Ltd cut its U.S. rating from A- to BBB+. The Chinese have also expressed a negative outlook for the foreign currency rating of the United States. (Source: “Chinese agency Dagong cuts U.S. sovereign ratings to BBB+ from A-,” Reuters, January 16, 2018.)
What prompted this? U.S. debt. Evidently, the Chinese have not bought the theory that lower taxes will translate to faster economic growth. Rather, the feeling is that both risk and debt will be higher. The Chinese have expressed in no uncertain terms that they expect the dollar to go down in value. Rather than the drop being related to a deliberate effort from the White House to support U.S. exports, China’s reasoning comes from these concerns: excessive debt, financial deficit, and economic outlook.
How High Will Gold Go in 2018?
Trump and his Secretary of Treasury, Steven Mnuchin, are speaking from both sides of their mouths on the dollar. They are contradicting each other. There’s one thing that isn’t contradictory. The already weak dollar has been falling for over a year and the descent is getting steeper.
The EUR to USD exchange rate is one of the best barometers for the dollar. In December 2016, parity was within a few cents’ reach, at about $1.05 per euro. Now, the same exchange is at $1.25! Is it any wonder that the price of gold per ounce has gained about $100.00 in little over a month?
The last gold peak was in 2011 ($1,900/ounce) when all metals and commodities were peaking. Now that the dollar continues to remain low amid an unclear policy, overall confidence in the U.S. economy will spread beyond China. It will be a domino effect The acceleration of gold prices, after a period of coming to terms with reality, will proceed.
The gold price forecast for the next three months should maintain the present momentum, remaining at the $1,350-$1,400 mark. But you never know, the prospects for a bigger price increase to $1,600 or higher are already in place, given that we are looking at a possible U.S. dollar collapse.