
Dow Jones Industrial Average Soars, But What’s Ahead?
On Thursday, January 4, at 9:35 am, the Dow Jones Industrial Average crossed above the 25,000 level for the first time ever. Looking at this, one has to question what’s next.
You see, if you listen to the mainstream, it will have you convinced that the Dow will continue to move higher.
Advertisement

They will argue it’s because the U.S. economy is doing great and that corporate America is in great shape. Also, the Trump administration has cut the corporate tax rate. This will give a boost to company earnings.
But how high could the Dow Jones Industrial Average really go?
Dear reader, it’s important to understand what has happened over the past two years. The stock market has seen a melt-up. Stock prices have soared very quickly.
To give you some perspective, look at the chart below of the Dow Jones Industrial Average since early 2016.
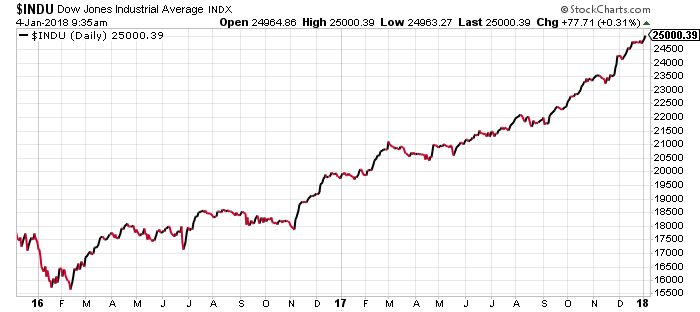
Chart courtesy of StockCharts.com
In early 2016, the Dow stood at 16,000. Now, it’s at 25,000.
Doing simple math; in a matter of about two years, the Dow Jones Industrial Average has soared 9,000 points.
Now, going back a little…
Looking from a historical perspective, the Dow increasing 9,000 points in two years is ridiculously fast.
After bottoming in March 2009, it took the Dow roughly five years to increase 9,000 points.
It can’t be stressed enough; we haven’t really seen what we are seeing on the Dow before, and this escalation shouldn’t be taken lightly at all.
Look at another chart below of the Dow Jones Industrial Average. It shows the long-term trajectory of the average. In the last two years, the index has seen an almost vertical move to the upside.
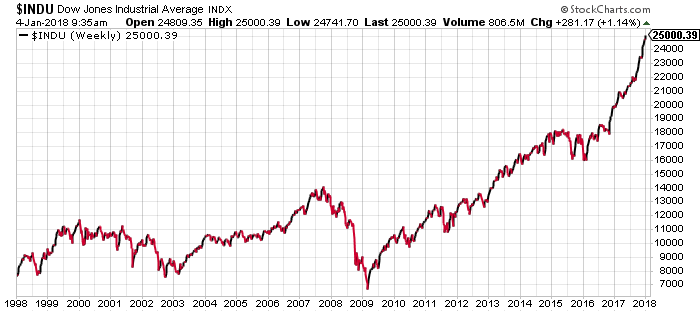
Chart courtesy of StockCharts.com
Are We Entering the Final Stage of the Bull Market?
Bringing everything together…
Here’s what must be understood; whenever there’s a rapid escalation to the upside, it’s time to be worried. It means there’s a lot of irrational buying and markets could really be getting ahead of fundamentals.
Also, we usually see this sort of behavior on the markets in the later part of the bull market—where a top may be nearing. If you look at the any previous stock market crash, you will see this sort of behavior just before it.
Don’t think this is true? Look at the chart below of the NASDAQ Composite Index just before the tech bubble bursting. Pay close attention to the circled area.
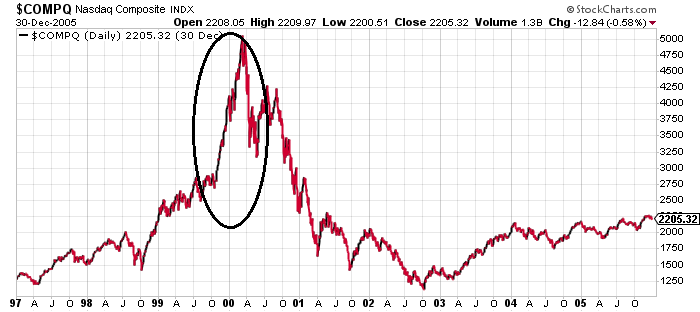
Chart courtesy of StockCharts.com
Notice how the NASDAQ was gradually moving higher, but starting in late 1999, there was a rapid escalation without any resistance. We could be seeing something very similar on the Dow Jones Industrial Average.
Before going any further, let me be very clear here; this is not a recommendation to sell whatsoever. When there’s escalation, markets could soar immensely before forming a top.
Looking at all this, I can’t help but say that we could be entering the final innings of the bull market that began in 2009. Stock investors beware: Don’t get too complacent.