Charts Project Optimistic Silver Prices Outlook For Long-Term Investors
Silver prices haven’t done well in the past few weeks, but it doesn’t mean investors should completely ignore them. The gray precious metal could generate massive returns to those who are looking at it for the long -term.
Remember this one thing when looking at the precious metal: ignore the noise.
Advertisement

Slightly Bearish Short-Term Outlook
Here’s the thing: if you pay attention to the charts, they suggest that in the short term, silver prices could run into some trouble. However, the downside may not be as severe.
Also Read:
Precious Metal Analysis: Keep Gold and Silver on Your Radar in 2017
Silver Price Forecast for 2017
Please look at the chart below. We are seeing formation of a symmetrical triangle on silver since mid-2016–this is when there’s an uptrend and downtrend and prices are getting in a narrower range. The direction isn’t known until the price break above the downtrend or below the uptrend.
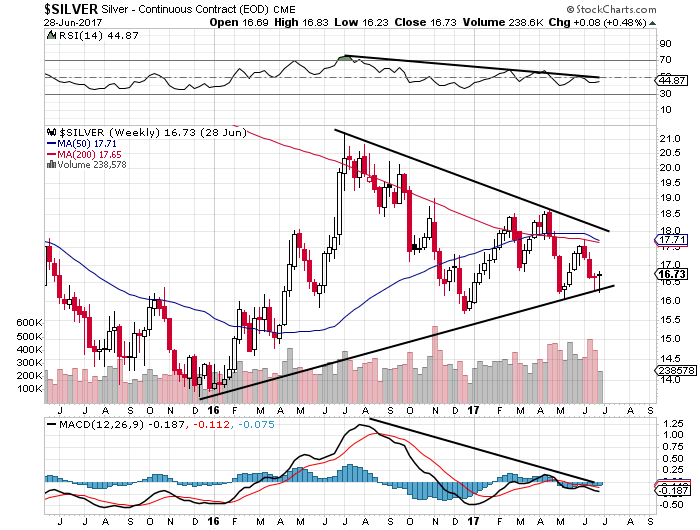
Chart Courtesy of StockCharts.com
Looking at the chart above, it looks as if the silver prices could see move to the downside because we see the momentum indicators suggesting sellers in control of the price.
Remember: it has to be questioned how far silver prices could fall. You see, $15.00 is a very critical level for the silver market. Below that level, a lot of silver mining companies can’t produce profitably.
Long-Term Technical Analysis Say Silver Could Be Great Buying Opportunity
Now, looking at the long-term chart, they say any short-term declining could be a great buying opportunity.
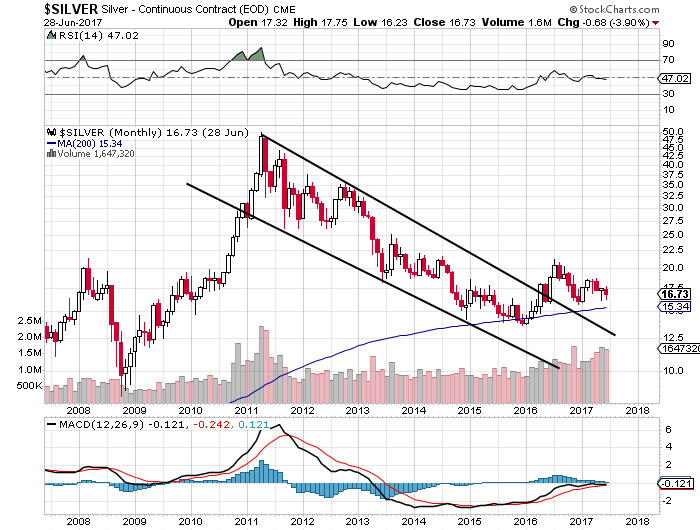
Chart Courtesy of StockCharts.com
When it comes to technical analysis, there’s one rule that every technical analysts agrees with: the trend is your friend until broke.
Since 2011, silver prices were trending, in a channel. Back in 2016, this trend was broken, and silver prices remain above it. Also, notice the volume at the bottom of the chart too; it’s been increasing as the prices are breaking above the trend.
At its core, this suggests buyers are coming as prices are going higher. It would be a sign of concern if silver prices were going higher and volume was declining.
Lastly, look at another chart below. At the top portion, monthly silver prices are plotted and at the bottom correlation of silver prices to S&P 500 are plotted.
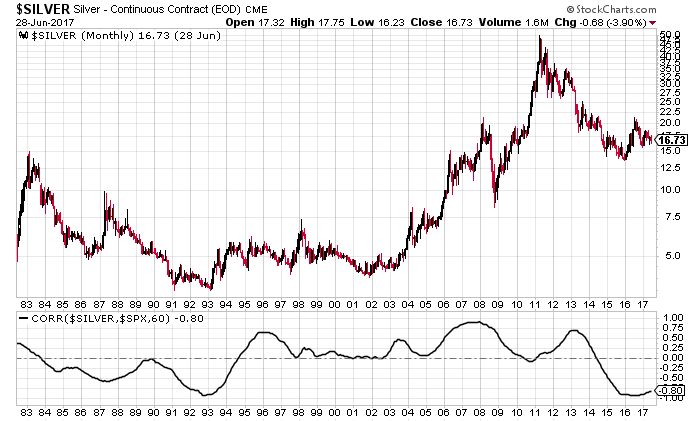
Chart Courtesy of StockCharts.com
Investors need to pay attention to two points on the chart: 1992-1993 and 2016-present. In these time periods, saw the correlation between S&P 500 and silver almost turned negative.
In 1992 when this happened, we saw an absolute bottom in silver prices. That price level hasn’t been tested since.
Looking at it now, it must be questioned if we are seeing some sort of bottom in silver prices and we if we will ever see these prices again. Obviously, with time we will know more.
Silver: The Most Ignored Asset?
Dear reader, silver remains, as I see it, one of the most ignored assets. It’s severely undervalued. When looking at the fundamentals and technical analysis, the outlook remains extremely bullish.
Mark these words: when the gray precious metal starts to get all the attention, by that time, it may be too late to get attractive prices.
I am paying extra attention to high-grade and low-cost silver producers. They could really show stellar returns when silver prices turn to the upside.