
Gold Price Charts Suggest Short-Term Trend Breaking in Favor Of Bulls
For gold bugs looking for direction on gold prices, it’s important to look at the charts. They are painting a bullish outlook for the yellow precious metal.
There are three charts that investors must watch carefully.
Advertisement

First, look at the daily gold price chart. Not too long ago, the price of gold broke above its 50-day moving average (the blue line on the below chart). What does that mean? It says that the intermediate-term trend has turned in favor of bullish investors.
Note that, as this is happening, we are also seeing momentum indicators suggesting that gold buyers are present, are buying, and could control the price. This is bullish.

Chart courtesy of StockCharts.com\
The key level to watch is around $1,278 per ounce; that’s the 200-day moving average. If the gold price is able to break above that moving average, we could see a solid move to the upside.
The last time gold bounced above its 200-day moving average was near the end of 2017. After this happened, we saw a 10% move to the upside.
Momentum Is in Favor of Gold Bulls on the Weekly Chart
Now let’s look at the weekly gold price chart.
On this chart, it’s important to pay close attention to the moving average convergence/divergence (MACD), which is plotted at the bottom of the chart and circled.
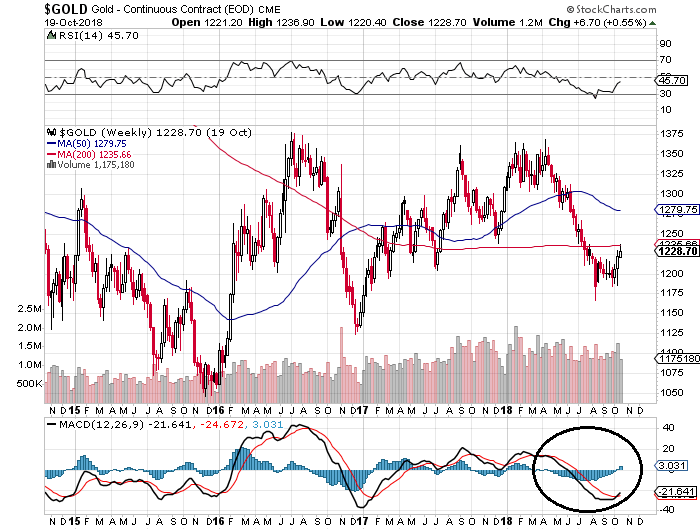
Chart courtesy of StockCharts.com
Notice how the two lines are crossing over? Crossovers like this are considered very bullish and are even considered as a “buy” signal by technical analysts.
Beyond this, on the weekly chart above, look at the 200-week moving average. Gold prices are fighting this moving average. If the price is able to break above this average, we could get a signal that the long-term trend has turned to the upside.
Monthly Gold Price Chart Tells Us $2,000/Ounce Could Be Possible
Lastly, look at the monthly gold price chart below.
On this chart, we are seeing a chart pattern called a symmetrical triangle. This pattern forms when the price consolidates.
A symmetrical triangle isn’t a bullish or bearish pattern; the direction is only known once the price breaks above or below the triangle. If it breaks above the triangle, an upside move will follow.
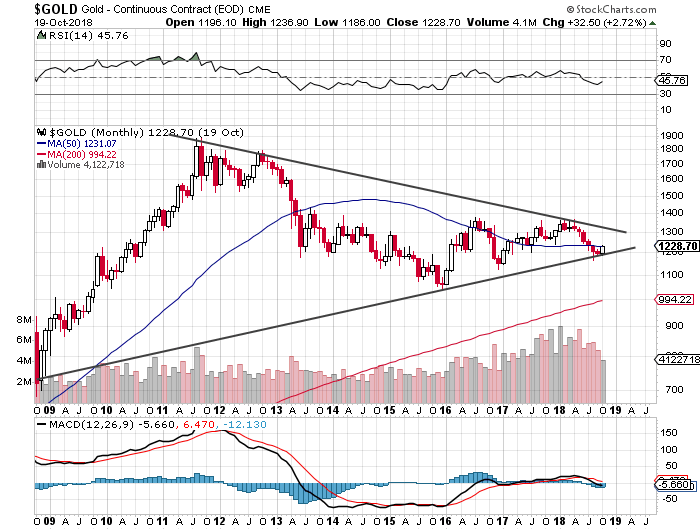
Chart courtesy of StockCharts.com
Remember, with every chart pattern, there are usually targets associated with them. With a symmetrical triangle, technical analysts take the widest part of the triangle and add it to the breakout level.
With gold prices, the widest part of triangle is the price action between 2011 and 2015, which is roughly $800.00 wide.
If we assume that the price of gold will break above the triangle (it could happen, given that trading volume has been increasing and momentum has been in favor of bulls over the past few years), we could get a gold price that’s above $2,000.
Gold Price Outlook: Gold Could Shine In 2019
Dear reader, gold has been ignored over the past few years. But this could be changing now. The charts tell us that bullish sentiment is building up in the market.
I believe that 2019 could be great for gold investors. There could be a rapid move to the upside.
In the midst of all this, don’t overlook gold mining stocks. They could provide leveraged gains if gold prices soar.