
WMT Stock: Setup for a Plunge?
Wal-Mart Stores Inc (NYSE:WMT) is known to pressure its suppliers in order to get the lowest costs. This forces these suppliers to manufacture in parts of the globe where is labor is cheap. The new Donald Trump administration’s views on global trade are set to put a damper on WMT stock.
The Trump administration is alleging that it will set tariffs and taxes on imported goods. These proposed policies will cause the cost of production to increase, and this will squeeze margins and wreak havoc for both Wal-Mart and its consumers as these new higher costs will need to be absorbed.
Advertisement

Wal-Mart stock has been trending lower at a time when the major market indices are breaking records and forging new all-time highs. This in itself is a bearish omen, and should set off some alarms. If an investment cannot appreciate when the broad market is rallying, then when can it? If a market correction does ensue, I believe that a relatively weak performer like Wal-Mart stock is going to get pounded with fists of selling pressure.
Something is not right with Wal-Mart stock, and the price action supports this notion.
In January 2015, a major sell-off gripped WMT stock and, by November, it lost 36.9% of its value from peak to trough. After a bottom was attained in November 2015, a rally ensued. I have taken a look at this rally and I have found some issues with it. These issues arise from the level at which the rally terminated, right at an important technical level.
The following Wal-Mart stock chart illustrates the technical level at which this rally terminated.
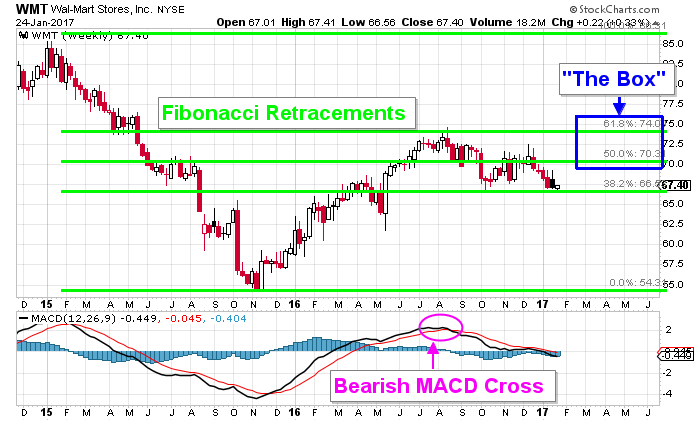
Chart courtesy of StockCharts.com
After Wal-Mart stock bottomed in November 2015, a substantial rally ensued. WMT was up 37.6% from trough to peak before the rally finally terminated. The problem with this rally is that it terminated at a significant technical level outlined by the Fibonacci retracement numbers.
Fibonacci retracement numbers are a popular tool that traders employ to target counter-trend price objectives. The theory behind these retracement numbers is that a stock will retrace approximately 50%–62% of the primary move before the primary trend reasserts itself.
The range between 50%–62% is what traders refer to as “the Box.” Traders eye this level to time entries and exits of prospective trading positions because of the significance that this level portrays. The rally off the November lows terminated after it entered the Box. This price action suggests that the rally off the November lows was only a counter-trend move, and that the the primary bearish trend toward lower prices is now set to resume.
The moving average convergence/divergence (MACD) indicator is a simple and effective trend-following indicator. Signal-line crossings are used to confirm bearish or bullish momentum. A bearish cross was generated in August, and this signal still remains in effect, suggesting that bearish momentum is dominating and the path of least resistance is lower.
Both of these tools suggest and support the notion that lower prices are set to prevail.
The following Wal-Mart stock chart illustrates the important juncture that WMT stock currently sits in.
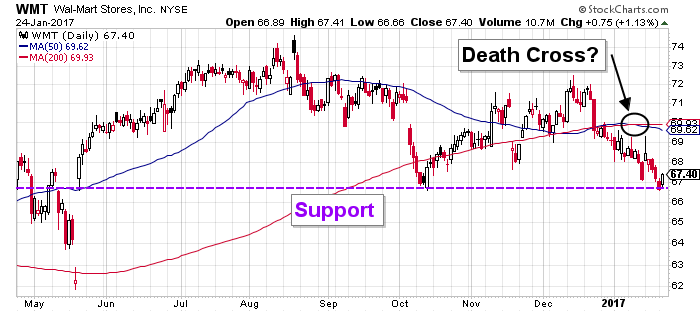
Chart courtesy of StockCharts.com
The stock chart above illustrates that WMT stock is currently testing a critical level of price support. The level has supported Wal-Mart stock since May of last year, and WMT stock is currently sitting right on it. A close below this level could set off a plunge that would reinforce the notion that the primary trend is toward lower prices.
Credits: Flickr.com/Mike Mozart
The convergence of the moving averages does not provide any solace for the WMT stock bulls, as a death cross was just generated. A death cross is bearish signal that is generated when the faster 50-day moving average, highlighted in blue, crosses below the slower 200-day moving average, highlighted in red. This signal is used to confirm that the current trend and a death cross confirms that a bearish trend toward lower prices has begun.
Bottom Line on WMT Stock
Bearish price action and bearish signals continue to mount that support a bearish view on WMT stock. I am watching Wal-Mart stock in anticipation of a close below price support. A close below support could spark a sell-off that sends WMT stock plunging.