U.S. Dollar: Teetering on the Edge
The U.S. dollar finds itself in a most peculiar position at the moment, and this comes at a time when most analysts are extremely bullish on the dollar’s prospects. Fundamental factors, such as a rising interest-rate environment should be enough to prop up the dollar and send it higher, but logic is not manifesting into a higher dollar valuation and, instead, the price action on the U.S. dollar chart is becoming increasingly worrisome. Could this be the beginning of the once-touted U.S. dollar collapse, which many pundits proclaimed was an inevitable event?
We are not going to go as far as proclaiming the end of the U.S. dollar, for obvious reasons. Rather, we will outline the indications on the U.S. dollar price chart that are causing us some serious concerns. These concerns are suggesting that a downdraft in the value of the dollar is near and that, unless the dollar strengthens immediately, U.S. dollar weakness will manifest. This potential weakness is why a U.S. dollar collapse can also not be ruled out.
Advertisement

This potentially bearish view on the dollar has been generated by analyzing indications on the following U.S. dollar price chart.
The above price chart illustrates the fact that a very precise bullish trend has developed off the lows that were created in May 2014. This bullish trend contains the quintessential characteristic that defines all bull markets, which is a trend consisting of higher highs and higher lows.
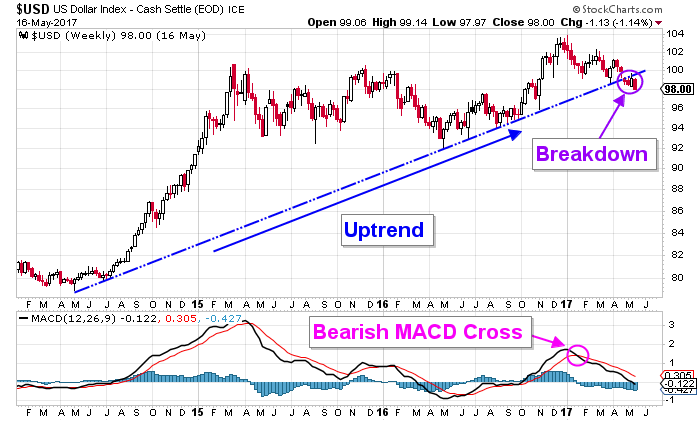
Chart courtesy of StockCharts.com
This trend that contains higher highs and higher lows is effectively captured using a simple uptrend line. This trend line is created by connecting the higher lows. The precision of this trend line is what really sticks out, because this trend line has been created by using nine points of contact.
Using this trend line as a tool is almost as easy as it was to create. This simple trend line has been acting as a level of price support where buyers have come in to support this price whenever it has been tested from above. As long as the U.S. dollar was trading above this trend line, I could have only assumed that the trend remained pitched toward higher prices.
The breakdown that is highlighted on the U.S. dollar price chart has become a serious cause for concern. The precise trend line that has supported the price for the last three years has failed to continue to do so, and the U.S. dollar is now trading below it.
The ramifications of this break below the uptrend line is being reinforced by the bearish alignment of the moving average convergence/divergence (MACD) indicator. MACD is a trend-following momentum indicator that uses signal-line crossings to distinguish between bullish and bearish momentum. This indicator turned bearish in January of this year, and it has remained in bearish alignment, implying that bearish momentum continues to govern the predominant direction in which the U.S. dollar is trending.
To compound this bearish view that has now surfaced, the following U.S. dollar stock chart illustrates a constructive pattern breakdown.

Chart courtesy of StockCharts.com
This price chart illustrates that, while the U.S. dollar remained above the uptrend line, the bullish trend was driven by constructive price action. Constructive price action is an essential characteristic of a sustainable trend, and it consists of a two-wave structure. This structure consists of an impulse wave and a consolidation wave.
The purpose of an impulse wave is to promote the forward progression of the price. This wave can come in the form of an advance or a decline, but what remains the same is that the progression is substantial. The purpose of a consolidation wave is to create an environment where a new impulse wave can develop and, as result, this wave is where any overbought or oversold conditions are alleviated. This wave usually comes in the form of a trading range, and is characterized by its lack of price progression.
In November 2016, the U.S. dollar exited the consolidation wave in upward direction, which served to suggest that another advancing impulse wave was set to develop. This seemed like a logical premise, because the United States is raising its interest rates, and higher rates are believed to be conducive to a stronger dollar.
The price action that followed the consolidation wave is quite puzzling, because the U.S. dollar fell back inside the consolidation wave. This, in itself, is a warning sign, because a failed breakout is not to be ignored, and it is suggesting that a trend reversal is in order. If the value of the U.S. dollar cannot follow through on a bullish indication, it is a testament to the bearish headwinds that are now swirling around it. The break below the uptrend line only serves to confirm the notion that the dollar is now set to experience further weakness.
Bottom Line on the U.S. Dollar
The U.S. dollar has broken down below a key uptrend line, and it is suggesting that lower prices are now likely to follow. This bearish view on the dollar is being reinforced by a multitude of technical indicators. Perhaps this is the beginning of something more sinister, like a U.S. dollar collapse. We can’t say for sure; only time will tell.