U.S. Dollar Index Is Useful Tool for Forecasting Gold Prices
If you want to know where gold prices are headed, pay attention to the U.S. dollar.
You see, the greenback’s value and gold prices have an inverse relationship. When the U.S. dollar rises in value, gold usually falls in price. And when the greenback declines, gold prices usually go up. Right now, we are seeing bearish action with the dollar.
Advertisement

Please look at the chart below of the U.S. dollar index, which represents the U.S. dollar’s performance compared to major currencies. Pay close attention to the circles and lines drawn on the chart.
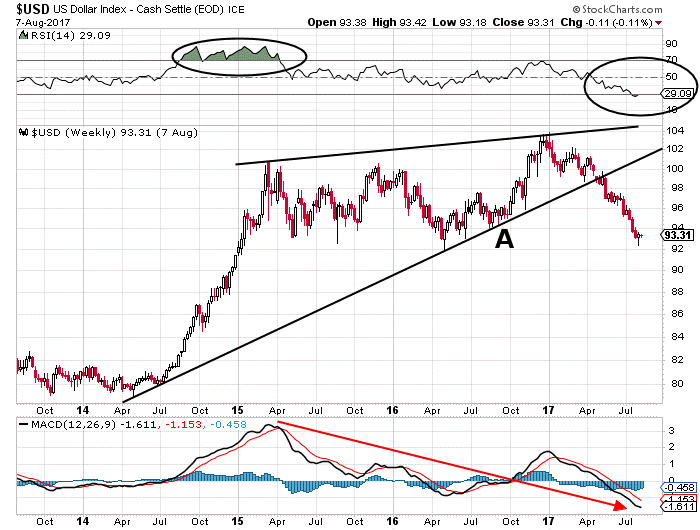
Chart courtesy of StockCharts.com
Here are some takeaways from this important chart.
In April 2014, the U.S. dollar index started trending higher. But, starting in early 2015, the greenback started to trade sideways, forming a bearish technical pattern called a “rising wedge” (the black trend lines drawn on the above chart). This pattern forms when prices are trending higher, but then start going sideways.
Traders usually wait until the price breaks below the upward-sloping trend line. Once the price breaks, they watch for it to reach close to the previous support level (Point “A” on the chart above).
The U.S. dollar index currently sits at that support level. Will it reverse to the upside from here? My bet is that it won’t.
Look at the moving average convergence/divergence (MACD)—a momentum indicator—at the bottom of the above chart. When it trends lower, it means that sellers are in control of the price, and lower prices usually follow.
Also look at the relative strength index (RSI) at the top of the above chart. It’s another powerful momentum indicator. There are two numbers that investors need to keep in mind when looking at the RSI: 30 and 70.
Pay attention to the circled areas drawn on the RSI. When the RSI remains above 70 and prices are trending higher, it means that more upside could follow. When the RSI remains below 30, and prices are trending lower, it suggests that buyers are embedded and prices could go much lower. This is what we see on the U.S. dollar index chart. Sellers seem to be piling up.
Given what’s happening with the U.S. dollar, it would be outright irrational to be bearish on gold prices, especially considering the historical relationship between the two.
For those who want evidence, please look at the chart below. It shows what happens to gold prices when the dollar declines.
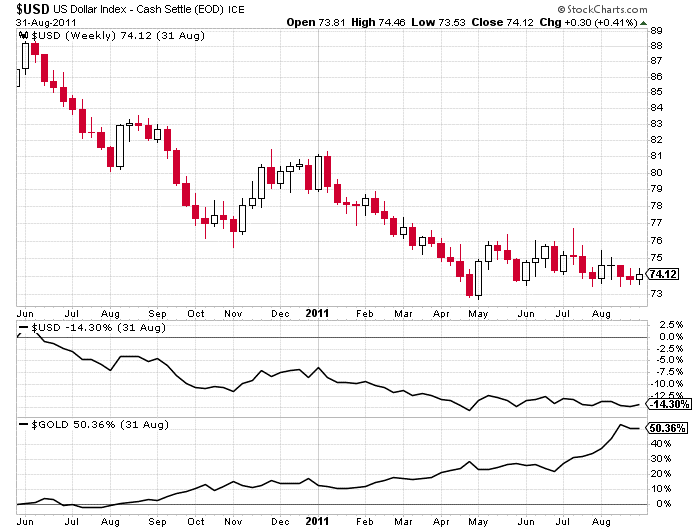
Chart courtesy of StockCharts.com
Between June 2010 and August 2011, the U.S. dollar index declined by more than 14%. In the same period, gold prices soared by more than 50%.
Year-to-date, the U.S. dollar index has declined by about nine percent and gold prices have risen by 10%.
I believe that, as the value of the dollar continues to deteriorate, gold prices will show even better returns with an escalation in the buying of gold. And I wouldn’t be shocked if gold prices end up showing 20% in total gains for the year.