Symmetrical Triangle Suggests that Gold Prices Could Jump
Gold prices could be setting up to soar in the short term. Don’t pay too much attention to those who say that the precious metal is useless to own. It is important to look at the gold prices chart; it’s saying that bullish sentiment is building.
What Is a Symmetrical Triangle?
Look at the gold prices chart below. You see, gold prices are forming a technical-analysis pattern called a “symmetrical triangle.” This chart pattern is developed when there are two contracting trend lines. Every time the price hits these trend lines, it reverses.
Advertisement

Once the price breaks out of these trends, investors could know the next direction and make decisions accordingly.
Remember, when it comes to technical analysis, there are usually targets associated with each chart pattern. With a symmetrical triangle, technical analysts take the widest part of the triangle and add it to the breakout price.
So, if we assume the widest part of the symmetrical triangle to be the area between November and December 2016 (noted by the black line on the chart above), the triangle is about $200.00 wide.
Now the big question is: if gold prices remain in the triangle, which direction could it break?
If you look at the moving average convergence/divergence (MACD) indicator at the bottom of the chart, it suggests that buyers are in control of the price and they could take it higher.
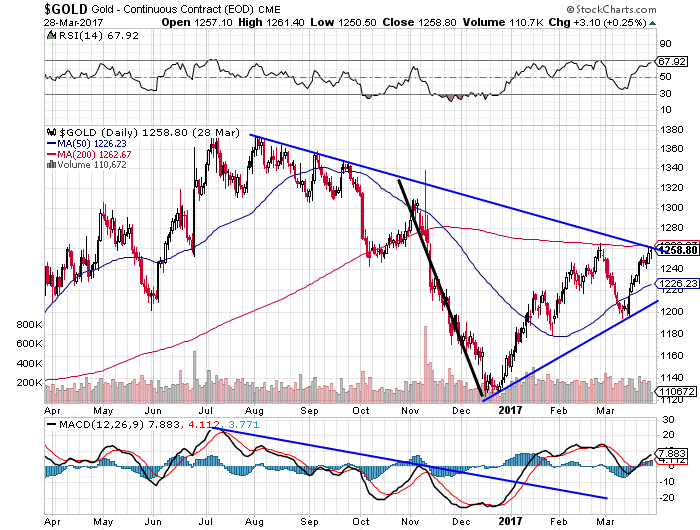
Chart courtesy of StockCharts.com
Also, notice the volume. As gold prices have bounced off the lows made near the end of 2016, the volume has been very persistent. This suggests that buyers are present and supporting higher prices. It would be worrisome if volume was decreasing as gold prices were moving higher.
In addition to all this, pay attention to the 50-day moving average. It’s well below the gold prices, and this means the short-term trend is pointing upward. Remember, trends tend to continue.
Keeping all this in mind, it wouldn’t be shocking at all to see a $200.00 move on gold prices if the prices break above the symmetrical triangle. This would take gold to roughly around $1,450.
If gold prices do hit the $1,450 mark, it would be the highest level since May 2013!
Investment Management 101
Let’s do some simple math here.
If gold prices go to $1,450 in the short term, investor-owning assets backed by gold bullion could generate returns of about 15% on holdings. For some, this may be more than enough. It’s slightly safer. Your investment is backed by an asset.
But, for those who are looking for massive returns with a little bit of risk, mining stocks are a place to be. They tend to provide leveraged returns on the precious metal prices.
Consider this: Barrick Gold Corp (NYSE:ABX), a well-known gold producer, is up a little more than 19% year-to-date, and the gold price is up 8.45% year-to-date. So, for every one percent increase in the precious metal, ABX stock increased by 2.2%.
Remember, with mining companies, investors are essentially buying the property with gold, and the management’s ability to take the precious metal from the ground.
Please note, this is not a recommendation to buy, rather it’s an example of what investors should look for when gold prices move higher.