
Dotcom Bubble Lessons Completely Disregarded
What did we learn from the dotcom bubble of 2000? Not much, judging by the excessive valuations that are currently permeating the market. With the dotcom bubble lessons unheeded, Wall St. and its merry band of investment bankers have once again bid up the market to lavish levels.
Price-to-earnings (P/E) ratios and other valuation metrics may not be so sky-high on an absolute basis, but broad swaths of normally prosaic equities look expensive. And this distinction really matters.
Advertisement

Overvaluation. That is basically the dotcom bubble explained. Comparing P/E ratios of the S&P 500, then and now, is not a completely linear comparison. With the height of the 2000 tech bubble valuations occurring in mid-1999 at 33.5 P/E, one could easily infer that, at today’s 26.5 P/E levels, there’s still plenty of upside remaining. And while that may be true, today’s broad market overvaluation takes on a completely different tenor.
Consider that in 1999–2000, an outsized portion of the collective S&P 500 P/E ratio of 33.5 was attributed to a Internet mania. By the end of the 1990s, the tech-heavy NASDAQ hit a P/E ratio of 200, an astronomical figure never seen before in modern finance. Every company with a “.com” attached to its name; every company even remotely related to the Internet; and every peripheral business associated with fiber optics, networking, or the Internet backbone went parabolic.
Biotech companies, as well, were given massive valuations as the sequencing of the genome became possible. Any study, no matter how preliminary, expressing positive clinical results sent these companies’ stocks to the moon. The outlandish moves in biotech almost rival those of Internet companies.
In 2000, the S&P 500 included huge tech components names like Cisco Systems, Inc. (NASDAQ:CSCO), Intel Corporation (NASDAQ:INTC), Nortel Networks Corporation (OTCMKTS:NRTLQ), and Microsoft Corporation (NASDAQ:MSFT). Every one of those companies—save Nortel, which was itself a member of the S&P 100 Index—had a top-10 weighting by market capitalization.
Big pharmaceutical giants like Merck & Co., Inc. (NYSE:MRK) and Pfizer Inc. (NYSE:PFE) were also part of the list. Obviously, this skewed overall valuations higher than the true broad market valuation would suggest. The broad market was still expensive but, without the Internet/biotech craze, and everything related to it, valuations were much less nose-bleed than meets the eye.
Top 10 S&P 500 Components for 2000
| S&P Component | Market Cap ($1,000) |
| General Electric | $474,929 |
| Exxon Mobil | $302,185 |
| Pfizer Inc. | $290,216 |
| Citigroup Inc | $287,331 |
| Cisco Systems, Inc. | $275,291 |
| Wal-Mart Stores Inc | $237,269 |
| Microsoft Corporation | $231,264 |
| A.I.G. | $229,422 |
| Merck & Co., Inc. | $215,900 |
| Intel Intel | $202,304 |
(Source: “Visual History Of The S&P 500,” ETF Database, August 26, 2013.)
Fast forward to today. A similar type of overvaluation “bubble” is occurring in the stock exchanges, except this one is much more generalized. Instead of historic valuations in a particular sector skewing the ratio upward, today many sectors are trading at (or beyond) historical highs. How do we know this?
Around 60% of the gains since 2009 have come from valuation expansion. This has pushed the S&P 500 to an all-time on a price-to-earnings before interest, taxes, depreciation and amortization (EBITDA) basis. (Source: “5 Charts That Scream “This Is It”,” Zero Hedge, March 22, 2017.)
Looking back on the dotcom bubble timeline, we see the same justifications for the lofty valuations. Back then, it was the belief that the Internet was going to change commerce forever. Today, it’s the belief that higher baseline valuations will last forever.
This goes part-in-parcel with the belief that central banks will keep pumping in liquidity to the markets forever. The term “ready to do whatever it takes” was coined by European Central Bank (ECB) President Mario Draghi in response to the 2012 bond yield crisis in the European Union (EU). The Federal Reserve might as well have made this playbook their own.
The Fed cut interest rates no fewer than 11 times in the immediately aftermath of the 2000 tech bubble, lowering the Fed Funds Rate (FFR) from 6.0% at the start of 2001, to just 1.75% by the end of it. This extreme monetary easing was one of the dotcom bubble lessons we would see play out in subsequent crises. Namely, the cheap supply of credit to keep consumer spending primed. As consumer spending equates to around two-thirds of Gross Domestic Product (GDP) output, the Fed’s playbook starts with supply of cheap credit.
But it doesn’t end there.
It was in February 2000 that the Authorization For Domestic Open Market Operations was born. This allowed the Federal Reserve Bank of New York to “buy or sell U.S. government securities… in the open market, from or to securities dealers and foreign and international accounts maintained at the Federal Reserve Bank.” (Source: “Minutes of the Federal Open Market Committee February 1-2, 2000,” The Federal Reserve Board, February 2, 2000.)
In order words, largely in response to the dotcom bubble crash, the Federal Reserve granted themselves the power to conjure up more debt to purchase assets like Treasuries and mortgage-backed securities. The Fed would liberally come to use these powers in future bubbles, such as the Troubled Asset Relief Program (TARP) following the 2008 U.S. housing crisis. Although Congress only authorized $700.00 in the original iteration of TARP, the final tally is much higher; $4.6 trillion according to some estimates. (Source: CMD Releases Bailout Tally, $4.6 Trillion in Federal Funds Disbursed, Center For Media And Democracy, April 1, 2010.)
If there were any lessons learned from the dotcom bubble, it’s that government would openly intervene to prevent the forces of capitalism to sort things out on their own. While the Internet craze brought forth the capital and enterprising interest which allowed the Internet to thrive, the dotcom bubble burst was also the advent of interventionist government economic policies in place today.
What Did We Learn from the Dotcom Bubble Crash?
We learned quite a bit from the dotcom bubble burst, depending on the answers one is looking for. The obvious dotcom bubble lessons entail the completely unrealistic earnings expectations that drove valuations sky-high, to levels which were wholly unsustainable.
This last point wasn’t even in hindsight; plenty of investors saw the euphoria for what it was, but chose to play along anyway. Many people thought they were nimble enough to sidestep the chaos before the mass selling began, akin to a game of musical chairs. But, in reality, only the most active day traders really could.
Considering the carnage which took place, it’s shocking that these dotcom bubble lessons learned (supposedly), are being completely disregarded today.
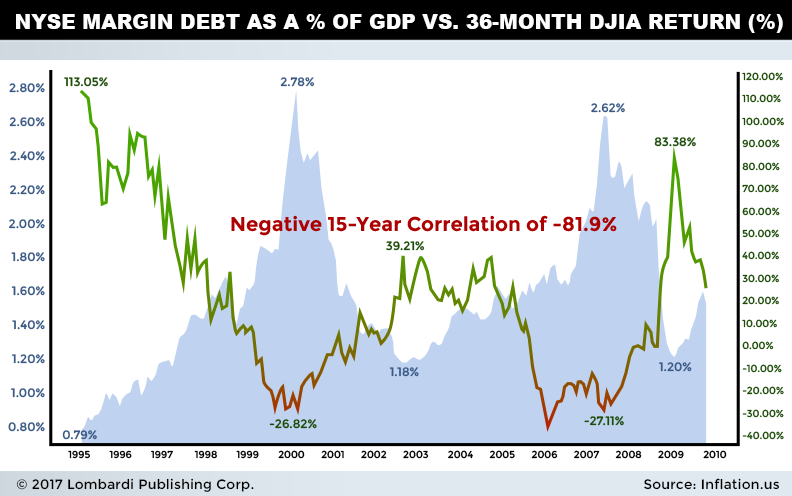
Margin debt as a percentage of U.S. GDP is currently at 2.69%, the second highest level of all time, and just shy of the dotcom record of 2.78% experienced at the peak. Aggregate New York Stock Exchange (NYSE) margin debt is also breaking records, currently at $476.38 billion. This figures is 25% higher than the 2007 pre-housing crisis period, and 71% higher than 2000. Since the trough in 2009 following the housing market crisis, margin debt has increased 175%.
This is concerning for market bulls for a couple of reasons. First, high levels of margin debt are historically linked to cyclical market declines. Over the past two decades, any time the NYSE margin debt as a percentage of GDP has peaked between 2.62% and 2.78%, the Dow Jones Industrial Average (DJIA) has declined 27% over the following 36 months. The correlation between margin debt and market declines is unmistakable. (Source: Ibid.)
Secondly, with market sector correlations at all-time highs, the risk of a “flash crash”-type situation keeps rising. With the pronounced increase in market share of index funds and “black box” algorithmic trading, volumes have fallen sharply and individual stock volatility has increased precipitously.
In today’s environment, something as trivial as a badly executed order can now inadvertently create a price trend that algorithmic black boxes feed on. In other words, a modest drop in retail stocks, for example, can cause reverberations in other unrelated sectors because of their association to the parent index, causing a potential broad market sell-off.
We’ve already seen evidence of the carnage that unrestrained selling (and algorithmic bid-pulling) can cause. On May 6, 2010, the DJIA lost close to nine percent when the market literally crashed, going bidless on many stocks. The subsequent report by the U.S. Securities and Exchange Commission (SEC) and Commodity Futures Trading Commission cited a “hot potato” among high-frequency traders buying and re-selling e-mini contracts. Some orders were executed at totally disconnected prices, from one penny to $100,000 per share before resetting toward pre-crash levels by 3:00 p.m. (Source: “The 2010 ‘flash crash’: how it unfolded,” The Guardian, April 22, 2015.)
The flash crash on August 24, 2015 was another feeding frenzy of disjointed selling, enhanced by the tight correlations between sectors. The S&P 500 opened at 1965.15 and fell five percent within minutes. End-of-day losses were pared, but Wall Street was shaken by how quickly and unobstructedly hundreds of billions of dollars could be wiped out by little more than a computer glitch.
After all, algorithms don’t ask questions. They simply react according to the programming they’ve been given. Today’s market is only as strong as its weakest correlation, and this should worry market participants everywhere.
In the end, I’m disheartened to say that very few of the dotcom bubble lessons have been learned, at least as reflected in the stock exchanges these days. Valuations remain frothy (albeit more dispersed), investors continue to gorge on margin debt, and regulators continue capital-destructive measures such as lowering rates to near zero. Many of the details portend differences, but the main tenets of irrational exuberance remain.
Dotcom bubble survivors should be particularly forewarned.