For the second quarter of 2017, so far 331 S&P 500 companies have reported positive earnings surprises. That’s awesome—so many companies are beating their earnings expectations.
But here’s the big negative; for the four-day period (two days before and then two days after their earnings announcements), the stock prices of these companies lost an average 0.3%! They posted better earnings, but their stock prices declined.
Advertisement

Digging deeper, 159 of those 331 S&P 500 companies reporting positive earnings surprises saw their stock prices decline over four percent. (Source: “S&P 500 Companies See Worst Price Reaction to Positive EPS Surprises since Q2 2011,” Factset, August 13, 2017.)
What does this mean? It means investors are selling on good news, which is negative for the stock market.
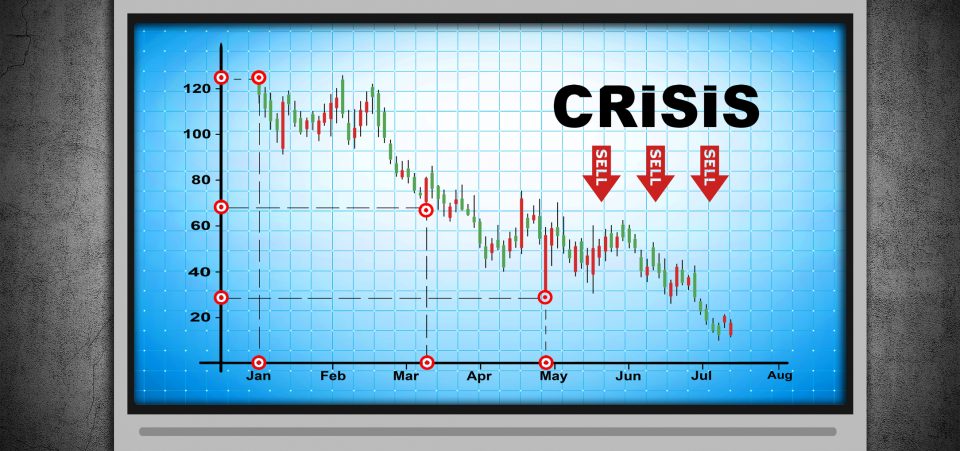
Stock Market Crash Happened the Last Time…
The last time something like this happened—so many companies reporting better-than-expected earnings and their stock prices declining on the news—was way back in the second quarter of 2011. A stock market crash followed.
See for yourself in the chart below. Between July 2011 and early October 2011, the S&P 500 dropped 20%.

Chart Courtesy of www.StockCharts.com
Bearish Stock Indicator Pointing to Crash Ahead
Dear reader; I have been writing quite a bit this year about different historically accurate stock market valuation gauges that say today’s market is severely overvalued and that a stock market crash is due. What I have told you about today—all those companies coming out with better-than-expected earnings and their stock prices falling—is an indication of investors selling on good news—something that is bearish for stocks. You can just add this to the ever-growing list of indicators pointing to a stock market crash ahead.
But remember; in a bull market, and in the euphoria stage we are now in, a stock market can remain irrational longer than a short seller can remain solvent.
The chart below shows how quickly the S&P 500 has risen since 2012. Notice the black horizontal lines I have drawn on the chart.
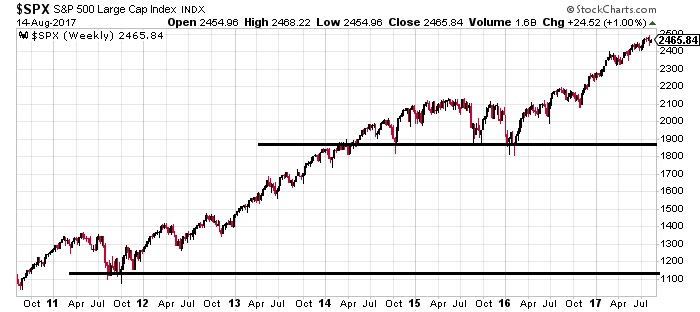
Chart Courtesy of www.StockCharts.com
When a stock market crash happens, key stock indices tend to fall to their major support levels. In the case of the S&P 500, this support level is at 1,900—about 22% below where the S&P 500 trades today. And if the bottom really falls out of the market, the next support is not until 1,100 on the S&P 500—more than 50% below the current level of the S&P 500.
With stocks overpriced by so many traditional and accurate market indicators, with the Federal Reserve about to raise interest rates for the fourth consecutive time since December 2016, and with the long-awaited cut in corporate taxes looking like a pipe dream, stocks could be in for a big fall.