
Inflated Stocks, Bonds, Debt, and Scandals
Will 2017 be the summer of investor discontent? If investors follow the tired and somewhat true adage of sell in May and go away, it might be. There’s simply too much going on right now for investors to feel too comfy in the long-in-the-tooth bull market. In fact, 2017 is shaping up to be the “everything bubble” and investors need to be prepared for a stock market crash.
Unlike the stock market crash of 2000, which was all about stocks, and the 2008 stock market crash, which was about stocks and housing, in 2017, it’s about stocks, bonds, debt (and housing), and scandals in Washington. If history is any indicator, investors could be in for a 40% stock market crash.
Advertisement

Stock Market Bubble
Stocks continue to trade near record levels but there are warning signs that all is not well on Wall Street. The S&P 500 has soared more than 255% since bottoming at 666 on March 6, 2009 and the bull market is now in its ninth year; the second longest since World War II.
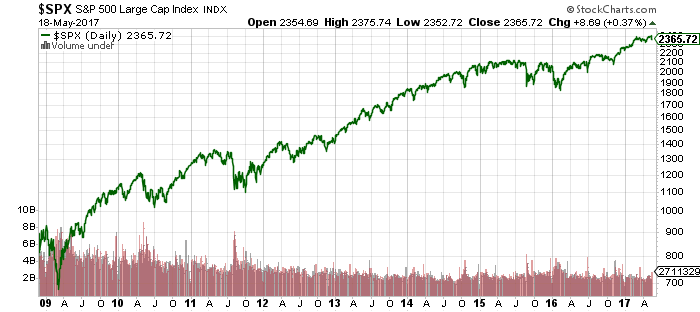
Chart courtesy of StockCharts.com
The longest bull market lasted from October 1990 through to March 2000: 114 months. Over the next two and a half years, stocks shed approximately 50% of their value.
This bull market has been fueled more by the Federal Reserve’s easy monetary policies than years of strong earnings and revenue growth. Despite financial engineering and an earnings recession, stocks continued to march higher. Now that stocks are reporting decent earnings growth (mostly, though, because they were abysmal), the S&P 500 has been notching new daily record highs.
Time and desperation have sent stock valuations into nosebleed territory. According to the cyclically adjusted price-earnings (CAPE) ratio, the S&P 500 is overvalued by 82%. The ratio compares current prices to average earnings over the last 10 years. The ratio is currently at 29.49; the long-term average is 16. This is higher than any point in history save for 1929, when it was at 30 and in 1999 it was at 45. (Source: “Case Shiller P/E Ratio,” Yale University, last accessed May 18, 2017.)

This doesn’t mean stocks are going to crash tomorrow, but it does mean that when stocks are this overvalued, it never ends well. In the weeks following Black Tuesday in 1929, stocks fell 25%. By 1932, stocks had lost 80% of their value. It took the Dow Jones Industrial Average 25 years to recover.
In March 2000, the tech bubble popped and stocks started to sell off. Initially Wall Street said it was just a stock market correction, but it turned into a bloodbath. Within 10 weeks, the Nasdaq had tanked 37%. By October 2002, the Nasdaq had spiraled down 78%. It took 15 years for the Nasdaq to recover from the 2000 tech bubble.
With interest rates on the rise, there could be a stock market correction this summer or fall. This of course doesn’t even factor in concerns about bonds, debt, and trouble in Washington. Add these factors in and stocks could experience a crash later in 2017.
Bonds Getting Squeezed
In November 2016, bond yields soared after Donald Trump won the U.S. election. Investors were convinced that Trump’s pro-growth, pro-business policies would help rejuvenate the U.S. economy and get annual gross domestic product (GDP) to a sustainable range of three to four percent. A far cry from the average 1.48% GDP growth during Obama’s two terms in office. It also happens to be the weakest period of economic expansion since World War II.
Since the November election, the bond market has been pricing out any economic positives that will come from Trump’s proposed tax plans, health care package, and stimulus spending. Investors, meanwhile, have been propping up stocks on the hope that Trump will be able to get his tax cuts passed.

Chart courtesy of StockCharts.com
But the tide is turning in the bond market. Optimism is fading fast and, judging by bond yields, it appears as though investors have lost hope that Trump will be able to get his pro-growth plans through Congress this year. Even 2018 might be a stretch.
This doesn’t mean that Trump won’t eventually get his economic campaign promises passed, but the markets are suggesting there’s a greater chance of political turmoil than economic successes. Especially if it’s proven that Trump interfered with an FBI investigation.
Whispers of impeachment would lead to a further deterioration in U.S. economic conditions, which would lead to a sell-off in stocks, which would put significant pressure on bond yields and put a crimp in any near-term rate hikes.
Houses and Household Debt
Stocks are in a bubble, yields are falling, and U.S. household debt levels are soaring. U.S. household debt reached a dubious milestone in the first quarter of 2017, when it surpassed 2008’s pre-financial crisis recessionary highs.
Total debt held by U.S. households reached a record $12.73 trillion in early 2017, topping the previous $12.68 trillion record reached in the third quarter of 2008, the height of the Financial Crisis. (Source: “Household Debt Surpasses its Peak Reached During the Recession in 2008,” Federal Reserve Bank of New York, May 17, 2017.)
In the third quarter of 2008, $9.99 trillion was held by housing debt, with $2.69 trillion in non-housing debt. In the first quarter of 2017, $9.08 trillion is held by housing debt and $3.64 trillion is in non-housing, high interest debt.
Mortgages still account for the most household debt at $8.63 trillion (68%), followed by student loans (11%) at $1.34 trillion, auto loans (nine percent) at $1.17 trillion, credit card debt (six percent) at $7.64 billion, and home equity lines of credit (four percent) at $456.0 billion.
While 2017 mortgage debt is a little below its 2008 highs, auto loans and student loans make up a bigger share of total debt. High interest credit cards aren’t too far behind.
Yes, an increase in sustainable borrowing is good, because it means Americans are borrowing to spend on big purchases like cars and houses. Sadly, the borrowing is coming at a time when secure, well-paying jobs are scarce, savings are depleted, and wage growth is anemic.
Thanks to record debt though, a bubble era confidence has returned to U.S. home builders. U.S. homebuilders felt more confident about the U.S. real estate market in early May than at almost any time since the housing bubble burst. (Source: “Housing Market Index,” National Association of Home Builders, May 2017.)
The association’s homebuilder sentiment index in early May rose to 70 from 68 in April. Analysts had expected the index to register 68 in May. This represents the second-highest level since mid-2005 and is just slightly below the 12-year high of 71, hit in March, 2017.
The sub-index that tracks how U.S. homebuilders expect the industry to perform in the next six months is also bullish, rising to its highest levels since June 2005…just before U.S. housing prices peaked.
Speaking of housing prices, according to the Case-Shiller National Home Price Index, housing prices are just six percent below their 2005 housing bubble peak. Moreover, U.S. housing prices are climbing at their fastest pace in nearly three years.
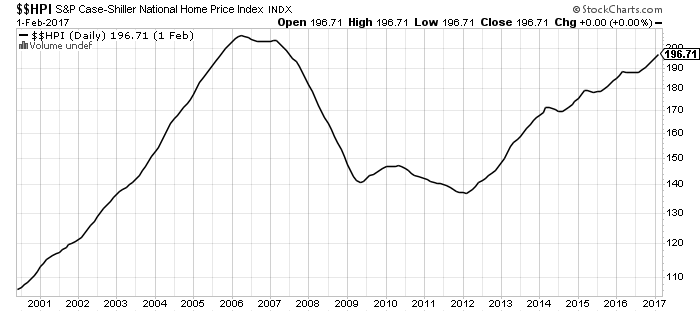
Chart courtesy of StockCharts.com
The national home price index advanced 5.8% in February, slightly above analyst expectations of 5.7%. This represents the most gains in 32 months. Not surprisingly, as housing prices have increased housing affordability has been falling since 2012. Interestingly, according to a new report, every single U.S. county is facing a housing affordability crisis. There are questions as to whether or not Trump can “Make America Great Again,” some might be questioning if he can make it affordable. (Source: “The Housing Affordability Gap,” Urban Institute, April 2017.)
In May 2017, first-time home buyers, which is a benchmark for how well the U.S. economy is doing, accounted for just 32% of all purchases; unchanged from February and March, and down from 33% in January. The 30-year average—and a number that economists consider healthy—is 40%. In 2016, first-time home buyers accounted for 32% of all existing home sales. (Source: “Existing-Home Sales Jumped 4.4% in March,” National Association of Realtors, April 21, 2017.)
Housing prices up, affordability down, and first-time home buyers are being priced out of the market. On top of that, rising interest rates could pose a big problem for already cash-strapped homeowners. Combined, this could be a big millstone around the neck of the U.S. economy; after all, housings combined contribution to U.S. GDP averages 15%-18%.
Scandals Ripping Up Washington
Scandals are a way of life in politics. But the scandals swirling around President Trump are a little reminiscent of the chaos that followed President Nixon. U.S. stocks have been on a losing streak as investors contend with anxieties over how Washington scandals and politicking could derail the Trump rally and bleed dry any investor optimism.
The most recent turmoil to grip Washington is over allegations that Trump tried to pressure then-FBI Director James Comey to drop his probe into ex-National Security Adviser Mike Flynn.
Whether this a Watergate-sized scandal is open for debate. But, if this, and other scandals get in the way of President Trump’s tax reforms, you can expect the markets to sell-off into a serious stock market correction, which could, turn into an avalanche.
Again, investors are keeping the bull market propped up on the hopes that Trump’s tax reforms will stimulate sustainable growth. On the surface, this shouldn’t be hard to do. After all, in his last year of office, Obama helmed the country to 1.6% GDP growth. First-quarter 2017 GDP growth was 0.7%.
But stimulating the largest economy in the world is proving to be more than a little challenging. Three rounds of Quantitative Easing couldn’t do it. It’s questionable whether tax cuts can results in real, long-term sustainable growth.
That said, if, because of scandals in Washington, President Trump can’t enact his tax cuts, investors should be prepared for a sell-off. At the same time, if Trump does get his stimulus package into gear and the results are underwhelming, investors can also expect a sell-off.
What will a Watergate-sized sell-off look like? Admittedly, it’s a little early to draw parallels to Trump and Nixon, but it’s important to see how the markets react.
In October 1973, Nixon fired the special prosecutor investing the failed break-in at the Democratic National Committee headquarters in June 1972. Watergate opened a floodgate of revelations about Nixon’s abuses of power; this includes wiretapping and investing political opponents. It resulted in Nixon resigning on August 9, 1974.
In the midst of the Watergate scandal, the stock market was enjoying a Nixon rally after his November 1972 election win. The Dow hit 1,000 on November 14, 1972, just a week after Nixon’s election win. A rally continued into 1973, with the Dow hitting 1,053.21 on January 9; but eventually the rally fizzled; the Dow ended 1973 at 850; a decline of 19%.
The Dow’s losing streak continued into 1974. On August 9, 1974, the day Nixon resigned, the Dow closed at approximately 777; by early October, the Dow had fallen to 573.22.
From the January 1973 peak to October 1974 bottom, the Dow lost 40% of its value.
Investors have shrugged off weak U.S. economic data, geopolitical tensions with the U.S and North Korea, Syria, Iran, and Russia, but it will be a different story if there is a Watergate-sized scandal in Washington.
A similar stock market correction or crash could easily be trumped should the Trump administration face a similar fate.