Weak corporate earnings, dismal growth for the U.S. economy, and a global economy in trouble are three reasons why a stock market crash in 2017 is a strong possibility. The S&P 500 could easily fall 33% from its current level.
Weak Corporate Earnings
While not well known, earnings of the S&P 500 companies actually contracted in five of the last seven quarters. Yes, the stock market is at record highs, but corporate America’s income statements are weak. Take out the stock buyback programs that public companies have been using to boost per-share earnings, and corporate America has a problem: lack of profit growth.
Advertisement

Also Read:
Stock Market Crash 2017? This Could Trigger a Stock Market Collapse
Warren Buffett Indicator Predicts Stock Market Crash in 2017
As I mentioned earlier this week, in 2015, 44% of all revenue at S&P 500 companies was earned outside of the United States. (Source: “S&P 500: Global Sales,” S&P Dow Jones Indices, last accessed March 7, 2017.)
The U.S. dollar has been on a tear for the past several months now. And this will put further pressure on corporate earnings, as a rising U.S. dollar is negative for companies with sales abroad.
Dismal Growth for the U.S. Economy
The U.S. Federal Reserve is adamant about raising interest rates this year…and it should be. After all, savers have been punished for too long. But, on the other side of the coin, our economy is too weak to absorb another interest rate hike (the last one was in December 2015).

Credits: Flickr.com/nemesisnom
Consumers make up two-thirds of U.S. gross domestic product (GDP). Higher interest rates will cost American consumers more. And they won’t make up the cost of their higher interest expenses on their higher wages, because wage growth has been stagnant. On the contrary, consumers will cut back on spending to endure higher interest payments, and this is negative for the U.S. economy.
The below chart shows the percentage change in U.S. GDP year-over-year, going back all the way to 1950. The gray-shaded areas indicate when the U.S. economy witnessed a recession.
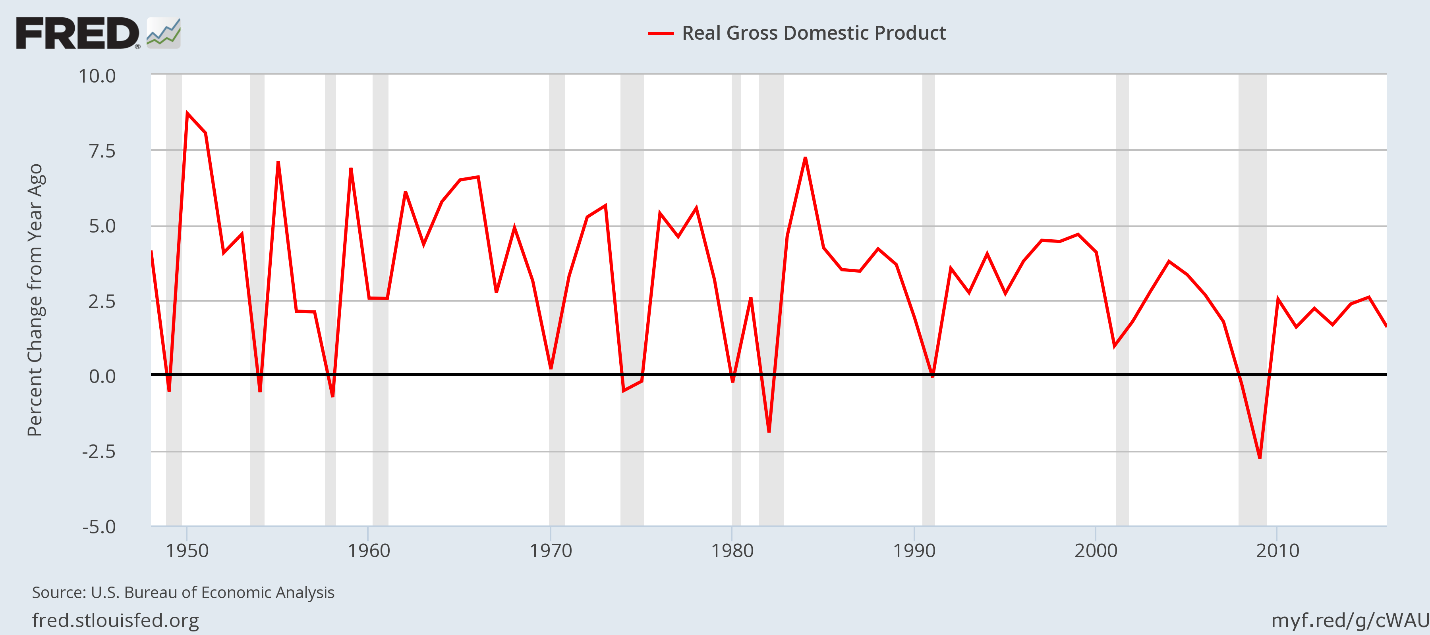
Noticed something? The U.S. economy had a solid bounce-back after the financial crisis, but, since 2011, our economy has stalled. Yet, the stock market has skyrocketed to all-time highs. (Did anyone say “sucker’s rally?”)
Global Economy in Trouble
And it’s not just the U.S. economy that is fragile. The global economy is in even worse shape than our own economy.
The eurozone crisis is far from over. Britain has voted to leave the eurozone, and Italy’s banks are on life support. I get a chance to go to Europe several times a year. When I talk to the locals, all I hear is how they are struggling. And the economic data out of Europe confirm this. The unemployment rate for youth is staggering, surpassing 40% in countries like Spain. (Source: “Spain Youth Unemployment Rate,” Trading Economics, last accessed March 10, 2017.)
And other major hubs in the global economy remain fragile. China is reporting its poorest economic performance in years, while Japan is still moving in and out of recession. Other economies like Australia, Canada, and England are reporting anemic growth.
As the global economy slows further, the U.S. economy will be impacted. It would be naïve to think that stocks will go unhurt. And it wouldn’t be shocking if this time around we see a stock market crash in 2017 due to external factors.
Stock Market Outlook for 2017: This Chart Should Scare You
We could see quite the stock market crash in 2017. How massive could the sell-off be? Look at the chart below.
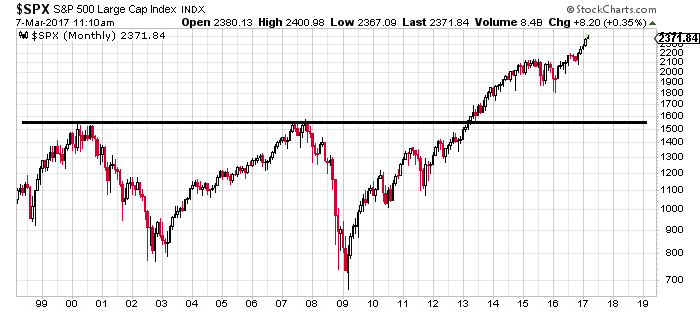
Chart Courtesy of StockCharts.com
On this chart, you will see that I have drawn a black straight line connecting the previous highs of the S&P 500. Historically, we know when a stock market crash happens; the market tends to re-test its previous highs. In this case, the previous highs are around 1,575 on the S&P 500; that’s a decline of over 33% from current levels.
The chart above is outright scary. The S&P 500 is up 264% since 2009. And the ascent has almost been a straight line up. The more aggressive the ascent, the bigger the stock market crash that follows.