QCOM Stock: Fair Warning
QCOM stock is being battered with selling pressure following a $1.0-billion lawsuit that was filed by Apple Inc. (NASDAQ:AAPL) against the company. This lawsuit alleges that QUALCOMM, Inc.‘s (NASDAQ:QCOM) licencing practices constitute monopolistic behavior.
This lawsuit has resulted in QCOM stock trading lower by 12.5%. This large drop in QCOM stock has shattered the bullish picture that was once suggested by the QUALCOMM stock chart, as well as the hopes and dreams of bullish investors.
Advertisement

The bearish news may seem like a surprise to some, and the price shock that followed seems to support this notion. But I have reason to believe that there were warnings that something bearish was in the works. These warning were indications from the QCOM stock chart which suggested that the bullish trend that began in February 2016 was starting to crack, and that the price of QUALCOMM stock was topping out.
The following QUALCOMM stock chart illustrates the first indications that suggested that the bullish trend was beginning to fall on its own weight.
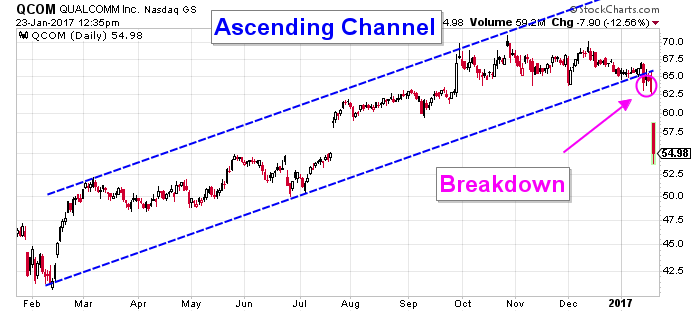
Chart courtesy of StockCharts.com
Since the lows that were generated in February 2016, QCOM stock began trending higher. This bullish trend toward higher prices was defined by using an ascending channel. An ascending channel contains two trend lines that represent support and resistance. The price oscillates within the bullish trend for as long as the price is contained within these two trend lines.
The first indication that the trend was in danger was when QCOM stock exited the ascending channel and closed below the lower trend line that represented support. QUALCOMM stock exited this channel on January 17, and every attempt to re-enter the channel was thwarted.
On January 20, QCOM stock closed below the lowest price that was generated on January 17, when QUALCOMM stock first exited this channel. This price action confirmed that QUALCOMM stock was set to trade lower.
No sooner than after the close on January 20, these bearish implications were vindicated when the pending lawsuit against QUALCOMM was announced.
The following QUALCOMM stock chart illustrates further indications that confirmed that a top had been formed.
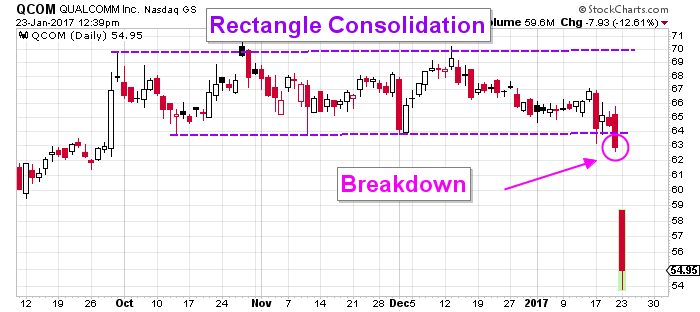
Chart courtesy of StockCharts.com
The pattern highlighted on the QCOM stock chart above is a rectangle consolidation pattern. This pattern consists of two horizontal parallel trend lines that define support and resistance. These trend lines mark the top and bottom of the trading range that began in late September. This pattern could act as both a continuation pattern or a reversal pattern. What separates these two apart is the direction in which the price exits this pattern.

Credits: Flickr.com/Kārlis Dambrāns
On January 20, QCOM stock closed below support, indicating that this consolidation pattern is, in fact, a reversal pattern which suggests that QCOM stock has formed a top. The close below resistance is illustrated on the QUALCOMM stock chart as breakdown.
On January 23, this breakdown was followed by a large price gap to the downside. The size of this gap, and the follow-through to the downside, both suggest that this gap is a breakaway gap. Breakaway gaps rarely get filled, and almost always indicate that a new trend has begun. With such bearish implications suggested by the price action on the QCOM stock chart, I would be on the lookout for bearish price patterns which would suggest that the trend toward lower prices is set to continue.
Bottom Line on QUALCOMM Stock
The pending lawsuit against QUALCOMM has resulted in a fairly large price shock, where QCOM stock is trading lower by 12.5%. This shocking move to the downside was not a complete and total surprise, because the QUALCOMM stock chart was indicating that something bearish was in the works. These indications involved broken bullish trends and completed reversal patterns.