
Volatility Index Suggests a Looming Stock Market Crash
It’s very difficult to even fathom the idea of a stock market crash when key stock indices are soaring. But, investors beware, ruling out a broad market sell-off would be a big mistake. There are indicators suggesting that a stock market crash could happen.
Just look at the Chicago Board Options Exchange (CBOE) Volatility Index (VIX), often referred to as the “Fear Index.” It is saying something you won’t hear in mainstream discussions.
Advertisement

VIX Hitting Lows Hints at a Sell-Off Ahead
Please look at the chart below, which plots the VIX at the top and the S&P 500 at the bottom. Pay close attention to the rectangles drawn on the chart.
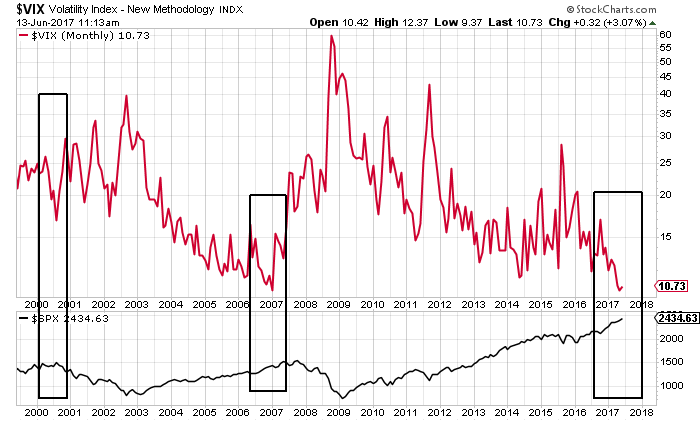
Chart courtesy of StockCharts.com
There are few things to notice on the chart above. Over the past 17 or so years, we have seen that, whenever the VIX turns lower, we have market tops in the works and, a few months later, a stock market crash follows. We saw this phenomenon play out in early 2007, and a stock market crash followed a few months later. Prior to this, we slightly witnessed it during the tech boom.
The VIX currently stands at its lowest level since 2007. With this knowledge, it has to be questioned whether we could be seeing a top forming soon, and then a stock market crash following soon after that.
Dear reader, it can’t be stressed enough: Be very careful. If there’s a stock market crash, it could take a severe toll on investment portfolios. Those who are planning for retirement could be in trouble.
How Big Could the Losses Be?
Now the big question: In case there’s a sell-off, how deep could the losses run?
It has been said in these pages before, but it must be repeated: During a sell-off, markets tend to come down to their major support level. For instance, in the previous stock market crash, in 2008–2009, key stock indices like the S&P 500 tested the support level formed back in 2003.
With this said, please look at the chart below of the S&P 500.
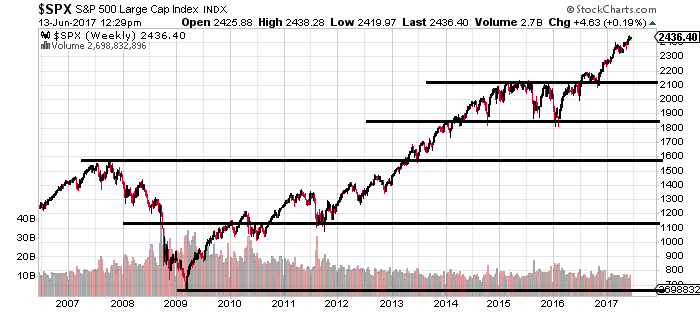
Chart courtesy of StockCharts.com
The straight black lines drawn on the above chart represent the major support levels for the S&P 500. Over the past few months, the S&P 500 has been going up without a hitch; we haven’t seen any sort of pullback. The higher it goes, the bigger the losses could be if/when it drops.
As it stands, the closest support level for the S&P 500 isn’t until the 2,125 area, which is roughly 13% lower than the current level. If that level breaks, the next level that the S&P 500 could find support at would be around 1,850, or 24% lower than the current level. Below this, support levels are around 1,575, 1,150, and 700.
How to Prepare for a Stock Market Crash
Please note, this is not a recommendation to sell your stocks, whatsoever. As it stands, key stock indices are trending higher, and going against the trend doesn’t usually end well.
But it wouldn’t be a bad idea to focus on capital preservation. It could be done by moving stops higher, or maybe selling a portion of a position and taking some profits off the table. Remember, the last thing that investors should do is give all their gains back.