Key Stock Market Indicator
Perhaps the savvy investors, who have picked up a tip or two enduring regular market corrections, could see a key stock market indicator coming. But there are few of those left. The stock market has steamrolled to the kind of record highs that serious analysts and money managers would be embarrassed to have predicted, let alone inform their portfolio decisions accordingly. By January 26, when the Dow went above 26,000, these same experts would have been embarrassed for not seeing how bullish the sentiment really was. Lucky for them, they only had to wait 24 hours to notice that their instinct was correct.
On Monday, February 5, there was a flash-crash. Goldman Sachs Group Inc (NYSE:GS) predicted it a few days earlier. (Source: “Was This Week A ‘Healthy’ Pullback? Doesn’t Seem Like It,” Benzinga, February 9, 2018.)
Advertisement

The most famous investment bank on Wall Street may have anticipated a flash-crash but this looks more serious. That there is a tectonic shift in the way investors are thinking about the market was confirmed on February 9, as stocks gave up any gains from the small recovery of the previous day. Then again, Goldman had noticed that the Dow had risen for the longest period ever without experiencing a five-percent correction.
Stock Market Collapse 2018
The market indicator that everyone should have noticed was as clear as dawn on a beautiful spring morning. The indicator has many possible names, but they all have something in common with excessive optimism or exuberance. How many times have we seen this show play out to its logical and inevitable crash conclusion? It was irrational exuberance that caused the 1929, 2000, and 2008 crashes. Valuations were simply too high. Price-to-earnings ratios are about 27-times. That’s much higher than average.
But that’s not all. Nothing quite speaks of the excess of optimism like the surge of cryptocurrencies and Bitcoin, in particular. Someday, sooner than later, historians and economists will write about his phenomenon in the same way they’ve written about the Tulip mania and South Sea bubbles of the 16th and 17th centuries.
In fact, indulge your curiosity and consider the South Sea bubble chart. Then look at the Bitcoin chart. Notice something? Suffice it to say, you don’t need contact lenses to see that they have an eerie familiarity.
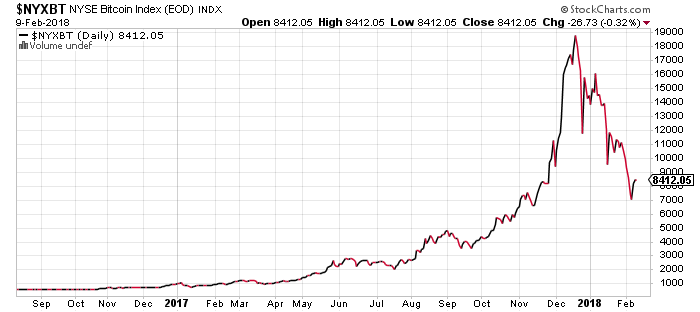
Chart courtesy of StockCharts.com
So excess optimism and hubris are the stock market correction indicators that everyone should have seen coming months ago. Cryptocurrencies are the most garish evidence that something is wrong. The fact that stocks followed suit with the timing of a Swiss military drumming line is where the grownups get separated from the children. This is not a coincidence. Consider these to be stock market crash indicators.
Stock Market Contrarian Indicator
The most contrarian market indicator to observe now, ironically, comes from none other than Warren Buffett. Who could be more traditional than Warren Buffett? Yet, good old-fashioned tradition is what’s missing from the excessive exuberance of the markets now. Buffett urges investors to consider how gross domestic product (GDP) relates to the capitalization of the S&P 500.
Now, the market-cap-to-GDP ratio is about 137%. That’s high, very high. When this ratio is around 60%-75%, the market is considered undervalued. When it’s about 95%-100%, it’s a Goldilocks market; just right. When it’s above 115%, look out, the pot is going to blow.
We’re at 140%, well beyond “terminal velocity.” The market correction, confirmed by the fact that the market has dropped 12% in less than a week, is a sign that uncertainty is setting in. The trigger may be, rather ironically, the very thing that helped boost the exuberance: Trump’s tax cuts. Many investors and the Fed say that inflation will increase, forcing the sudden end of quantitative easing. That could lead to more than just a bearish market phase. That could lead to a major market collapse in 2018!