Rising Gold Demand Suggests that Gold Prices Could Soar
If you pay too much attention to the daily gold prices, you could jump to the conclusion that it’s not worth the investment. That could be a big mistake. The yellow precious remains a solid opportunity for the long term.
Despite everything looking against gold, there’s a significant amount of demand for the precious metal. It’s really impressive.
Advertisement

Take the Perth Mint as one example. In September, the biggest mint in Australia—which is well regarded globally—sold 46,415 ounces of gold in bars and coins. In August, its gold bullion sales were just 23,130 ounces. This represents an increase of over 100% month-over-month, and was the highest amount of sales since January. Year-to-date, the Perth Mint has sold over 272,882 ounces of gold. (Source: “Perth Mint’s Sept gold sales double on month, silver up 78 pct,” Reuters, October 3, 2017.)
But, this isn’t all.
Look at India. The country is bringing in immense amounts of gold, and it’s going unnoticed by many. In August, almost $1.9 billion worth of gold was imported to the county. In the same month a year ago, it was more than $1.1 billion worth of gold. (Source: “Quick Estimates For Selected Major Commodities For August 2017,” Government of India Ministry Of Commerce and Industry, last accessed October 3, 2017.)
This represents an increase of 68.9% year-over-year (using the exact dollar figures). Mind you, over the past few months, we have been seeing double-digit growth in India’s monthly import figures.
If this doesn’t say there’s a gold rush in the making, I don’t know what does.
Gold Prices Outlook For 2018 And Beyond
I’m looking at the recent sell-off in gold as nothing but another buying opportunity for those who are focused on the long term.
Please look at the chart below of the daily gold prices.
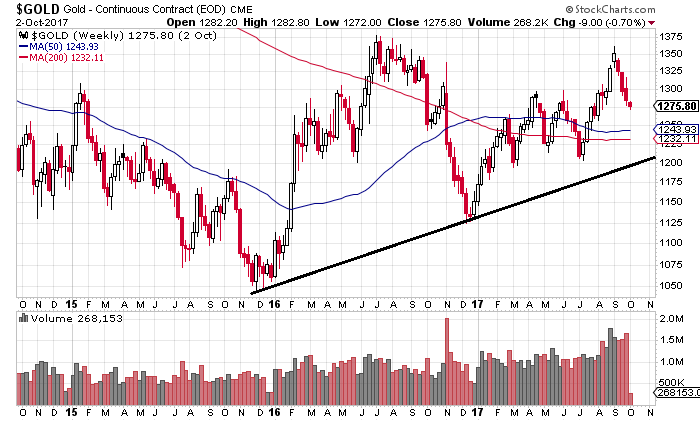
Chart courtesy of StockCharts.com
On the above chart, there are three things that investors need to pay attention to. These three factors suggest that bullish sentiment prevails in the gold market and that an upside could be ahead.
First, notice the black line on the chart. The trend that began in late 2015 remains intact. For it to stay intact, gold prices could even fall as low as $1,200. Anything below that price would be a worrisome.
Second, look at the blue and red lines on the chart. They represent the 50-week and 200-week moving averages. These moving averages remain below the current price of gold. This says that the long-term trends continue to point to the upside. The 200-week moving average is certainly worth keeping a close eye on. Since early 2017, it has been acting as a support level.
Third, pay close attention to the volume at the bottom of the chart. Since late 2016, we have seen the volume increasing as gold prices have risen. This is a very bullish development. It says that buyers came in as prices went higher. It represents excited buying.
With all this in mind, my opinion on gold hasn’t changed whatsoever. I continue to be bullish on the yellow precious metal. In just a few years, we could be looking at gold prices above $2,000.