Here’s Why a Stock Market Crash Could Happen
With the Dow Jones Industrial Average (DJIA) struggling to break above 20,000, there’s a significant amount of noise that suggests that a stock market crash could happen soon.
Investors should remember this one basic rule: never predict tops and bottoms. It could save them a lot of money.
Advertisement

Here’s something that must be understood as well: the Dow at 20,000 is really an irrelevant figure, and doesn’t really mean we have a top in place yet. A stock market crash could still happen soon.
Look at the chart below of the Dow between 2006 and 2009 and pay close attention to the circled area and lines drawn on the indicators. Notice something interesting?
In 2007, the Dow Jones Industrial Average topped around 14,000 level in October, but the rigorous losses, or the broad stock market crash, didn’t start until mid-2008. After the top was formed, losses were steady and then escalated eventually.
Note that prior to the top formation, the moving average convergence/divergence (MACD), which is a momentum indicator, was slowly turning bearish, and relative strength was moving lower as well.
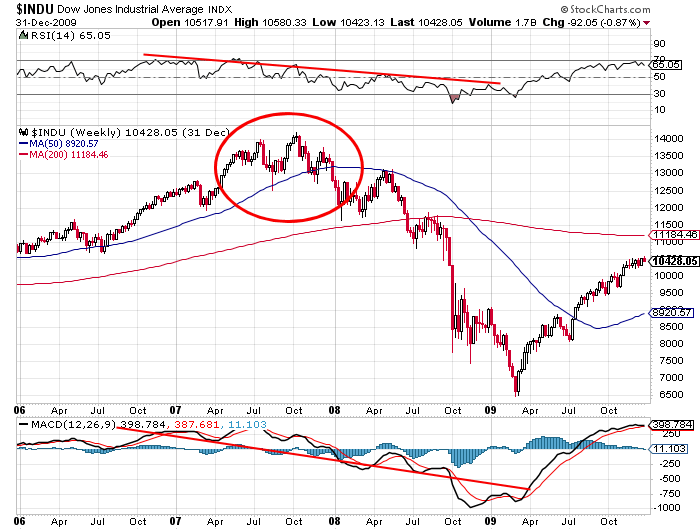
Chart Courtesy of StockCharts.com
At the very core, the top wasn’t confirmed until it was actually formed, and it took several months.
Now, look at the Dow trading closing to the 20,000 level in the chart below.
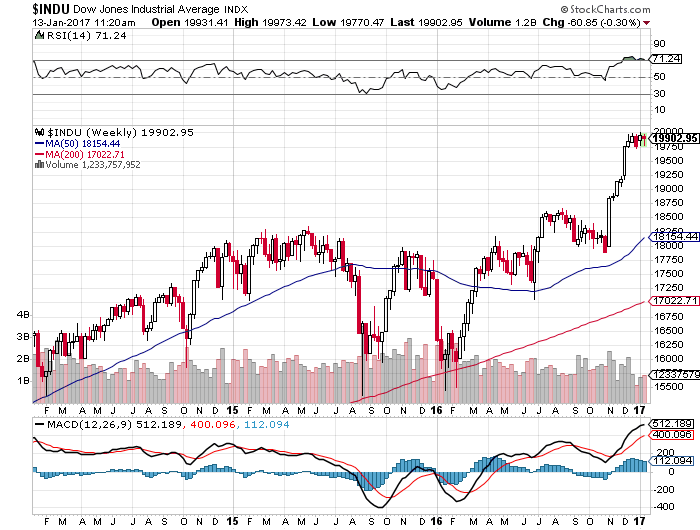
Chart Courtesy of StockCharts.com
The chart doesn’t exactly look like it did back in 2007, or in previous stock market crashes just yet.
The momentum indicator currently is in buyers’ territory. It’s saying that buyers are in control and could take prices much higher. The relative strength index remains in favor of buyers as well.
But, with all this, don’t for a second think I am bullish on the key stock indices. I am far from it. All I am trying to say here is that the number 20,000 is irrelevant, and calling it the top is outright foolish.
Here’s what I will say: if you look at the fundamentals, they suggest that we are closer to a top on the stock market, and eventually we could see a stock market crash.
Just pay attention to the earnings, for example, which are the most basic fundamentals for the stock market. They are anemic. For instance, earnings on the S&P 500 declined between the second quarter of 2015 and the second quarter of 2016. They increased slightly in the third quarter of 2016.
Going forward, given the rising dollar and conditions in the global economy, we see that the earnings may not be as great.
Also, keep in mind: since the previous stock market crash, key stock indices have increased substantially. Wouldn’t they be looking to take some profits off the table as uncertainty grows over the monetary policy at the U.S. Federal Reserve? It’s possible.
Stock Market Outlook for 2017: Grim Returns Could Be Ahead
The longer it takes for key stock indices like the Dow Jones Industrial Average to cross levels like 20,000, the more nervous that investors will become. And this phenomenon could cause them to just run for the sidelines. In the process, we could see a stock market crash. This could be happening in 2017.