Technical Analysis Says Gold Prices Could Soar to $1,675
It can’t be stressed enough, gold prices could be setting up to soar big-time in the coming months. It’s not just the fundamentals saying this, the charts are making a bullish case for the yellow metal as well.
From a technical analysis perspective, gold prices suggest that there’s bullish sentiment building up.
Advertisement

To get some idea, look at the weekly gold prices chart below, and pay close attention to the lines drawn on it.
You see, since the bottom in December 2015, gold prices have been forming a chart pattern called an “ascending triangle.” This pattern forms when there’s a preceding uptrend and prices find resistance on the upside.
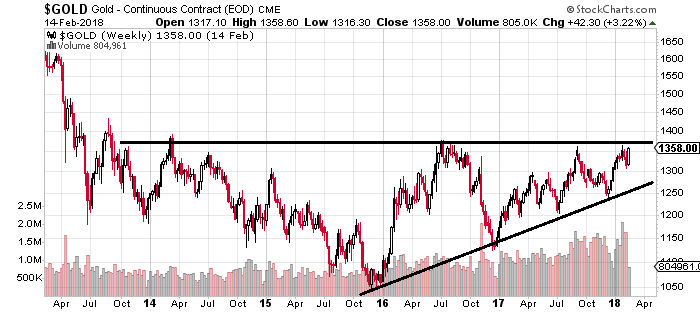
Chart courtesy of StockCharts.com
When this pattern is forming, chart watchers usually keep a close eye on the resistance level. In the case of gold, it’s around $1,375.
Once (and if) the price breaks above the resistance level, technical analysts call it a breakout.
Remember, with almost every chart pattern, there are targets associated with it. Once the price breaks above the resistance level, technical analysts usually take the widest part of the triangle and add it to the breakout point. This gives them a near-term target.
In the chart above, the widest part of the triangle is the range between December 2015 and July 2016. It’s roughly $300.00 wide.
If gold breaks above $1,375, we could see the price soaring to around $1,675.
Could this actually happen?
This time around, when the gold prices are near this level, we are seeing a lot of volume. At its core, this is saying that the rise is backed by buyers, and they are controlling the prices. So, it’s possible that gold prices could break above $1,375.00.
Institutional Investors Buying Gold
Also, know one more thing: over the past few years, it’s possible that a lot of traders have been shorting gold whenever it hit the $1,375 level. If prices break above that level, these traders may be forced to cover their short positions, and this could just add more to the gains.
In addition to all this, it’s important to know that gold is starting to get interest from institutional investors. Not too long ago, gold wasn’t liked by them because they believed that higher interest rates could cause precious metal prices to drop.
Now we see big hedge fund managers adding gold. For example, Bridgewater Associates, the world’s biggest hedge fund, headed by Ray Dalio, added gold to its portfolio through SPDR Gold Shares (NYSEARCA:GLD) and iShares Gold Trust (NYSE:IAU). (Source: “Dalio’s Bridgewater Boosts Gold Holdings in SPDR, IShares,” Bloomberg, February 14, 2018.)
Gold Prices Outlook 2018 and Beyond
Dear reader, it wouldn’t be shocking if gold prices outperform returns on stocks and bonds this year. Understand that the bullish case for gold continues to get stronger. There’s a lot of data that suggests this.
I wouldn’t be shocked if gold prices make a move above $1,375 and rally into the summer and fall.
In the meantime, I can’t help but look at mining companies. I see them as extremely undervalued, selling for pennies on the dollar. If we assume that gold prices are setting up to increase even 10%–15% this year, some mining stocks could double, or even more.