
These Indicators Making Strong Case for Stock Market Crash
Stock investors, beware. There could be a stock market crash, and it could be rigorous. Look at the indicators and ignore the noise.
When markets are rising, it’s important to check if they are backed by the majority of the constituents, or if only a few companies are skewing the indices. The latter is what you don’t want to see.
Advertisement

Sadly, as it stands, we are seeing weakness across the board, and only a few companies seem to be causing the stock markets to go higher.
Stocks Breaking Below Their Uptrend
With this said, please look at the chart below. Long-term readers will know; it has been mentioned here before as well. It plots the number of S&P 500 companies trading above their 200-day moving average.
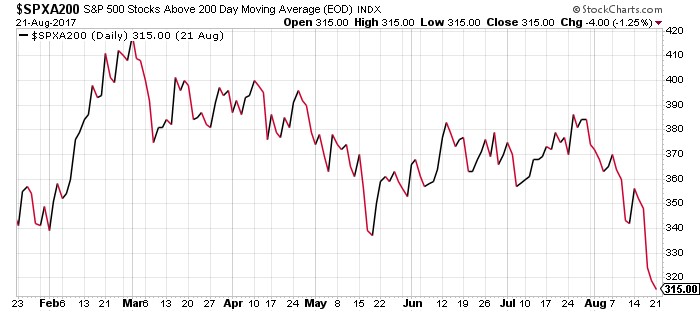
Chart courtesy of StockCharts.com
Why bother with this chart? You see, if a stock is trading above its 200-day moving average, it’s considered to be in an uptrend.
Also Read: Stock Market Crash 2017? This Could Trigger a Stock Market Collapse
So, looking at the chart above, one could say that the number of companies trading in an uptrend on the S&P 500 continues to decline. In early 2017, close to 420 of the S&P 500 companies were trading above their 200-day moving average. Now, this figure has dropped to 315.
This represents a decline of close to 25%!
This chart is certainly making a solid case for a stock market crash. It says there’s weakness brewing at the S&P 500.
S&P 500 Stocks Making 52-Weeks Low Highest in 18 Months
But, don’t just stop here. There’s another indicator flashing red and suggesting a stock market crash could be ahead.
Consider that currently eight percent of the S&P 500 stocks are trading at their 52-week lows. This is the highest number since February of 2016. (Source: “Stocks are flashing a bigger warning sign than they did for Brexit and the US election,” Business Insider, August 22, 2017.)
Going back a little; between January and early February 2016, key stock indices like the S&P 500 dropped 10%.
What does this mean? At its core, this confirms what we have said, saying there’s a significant amount of weakness under the surface and that a few companies could be sending the key stock indices higher.
Investors Losing Interest, Selling on Good News
There’s another indicator suggesting that investors are losing interest; look at how they are reacting when companies are beating their earnings estimates. In good markets, stock prices tend to soar as companies beat their earnings. We see the complete opposite happening.
According to FactSet Research Systems Inc., so far 331 S&P 500 companies have reported earnings that were above estimates. In the four-day period (two days before and two days after earnings announcement), they reported a decline of 0.3%. Mind you, this is the first time something like this has happened since the second quarter of 2011. (Source: “S&P 500 Companies See Worst Price Reaction to Positive EPS Surprises since Q2 2011,” FactSet Research Systems Inc., August 13, 2017.)
Adding more to the misery, 159 of these companies reported an average decline of four percent over the four-day period.
What does this mean? Essentially, this behavior says investors are selling on good news. This is usually not a good sign.
Stock Market Outlook: Massive Sell-Off Could Be Brewing
Dear reader, if there’s one thing I have learned over the years, it’s that when there are weaknesses in the market, become very cautious. Letting complacency take over could be a big mistake.
It certainly is very tempting to see the markets go higher each day and “miss out” on the gains. But remember, the biggest gains are made after a crash, not after key stock indices have made their all-time highs.
In conclusion, I will say only one thing; odds of a stock market crash are brewing. You don’t want to get stuck in it, when and if it happens.