A Stock Market Crash Could Be Coming Soon
No one wants to hear this when stock indices are soaring to all-time highs, but the odds of a stock market crash continue to stack higher each passing day. The market indicators I will tell you about today are flashing red and suggesting that big losses for stocks are ahead.
Let’s start with investor sentiment, which is something that really matters when it comes to the stock market. If investors turn sour, a stock market crash usually follows. And right now, investor sentiment is sinking.
Advertisement

The chart below shows the amount of assets sitting in funds that are betting on a stock market crash.
As the above chart illustrates, since July 5, investors started pouring money into funds that are betting that stocks will go down in price. The amount of money going into bear funds has increased by 20% in just a matter of days. This is a sharp jump in investors’ bets against the stock market.
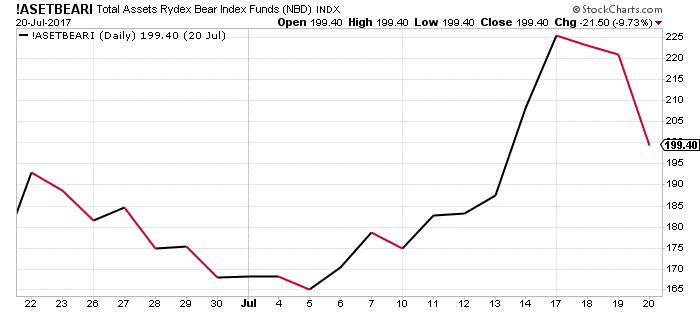
Chart courtesy of StockCharts.com
The chart below is of the National Association of Active Managers’ Exposure Index. At its core, this indicator tells us the percentage of stocks that active money managers hold in their portfolios.
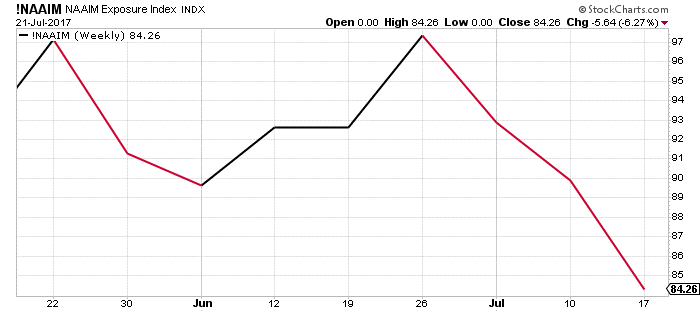
Chart courtesy of StockCharts.com
In late June, active money managers’ portfolios consisted almost entirely of stocks. At the time of this writing, their exposure to stocks has been reduced by about 20%. Money managers reducing their exposure to stocks is not a good sign. It means they are selling stocks at market highs, which is a negative indicator. It says to us that maybe they are expecting the stock market to collapse.
Finally, stock market valuations are overly stretched right now. U.S. stock markets are currently trading at valuations that are well above historical averages.
For instance, the cyclically adjusted price-to-earnings (CAPE) ratio stands at around 30.05. This is the highest valuation since just before the 2000 Tech Bubble (when irrationality prevailed and the CAPE ratio peaked at 44.2 in December 1999). The only other time that the valuation has been higher than it is now was just before the 1929 stock market crash (when the CAPE ratio peaked at 32.56 in September 1929). (Source: “U.S. Stock Markets 1871-Present and CAPE Ratio,” Yale University, last accessed July 23, 2017.)
Historically, whenever stock valuations reach these high levels, a stock market crash has followed within months. And that’s exactly what I believe will happen this time around.