
These Indicators Suggest a Stock Market Crash Could Be Ahead
Ruling out a stock market crash in 2017 could be a big mistake. Surely, key stock indices are soaring through the roof, but know that there are indicators screaming that massive losses could be ahead.
During a healthy stock market rally, usually a majority of the stocks tend to move in a similar direction. If you see an index moving higher, but its component is lagging, it’s a cause of concern. It essentially means that only a few stocks are driving the index higher, and this could warrant a stock market crash.
Advertisement

Something Is Broken at S&P 500
With this said, please look at the chart below. It plots a number of stocks on the S&P 500 that have been trading above their 200-day moving average (in red), and the S&P 500 price (in green).
Before going into any details, know that the 200-day moving average is used by technical analysts to identify whether a stock is trending up or down. If a stock price is above its 200-day moving average, it’s said to be trending upwards.
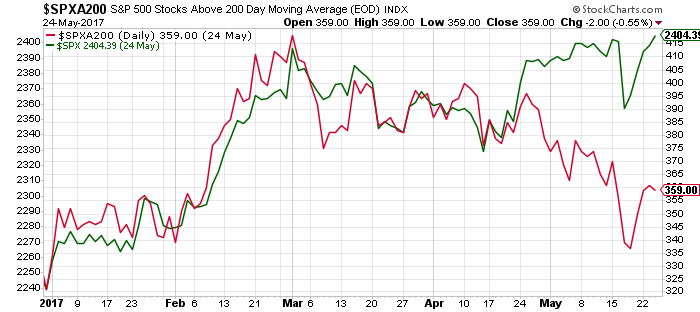
Chart courtesy of StockCharts.com
Notice something interesting on the above chart?
As it stands, we are seeing disparity between the S&P 500 and its component. It looks like the S&P 500 is broken.
The number of stocks trending upwards continues to decline, as the S&P 500 continues to move higher. This is a deadly combination that shouldn’t be overlooked. It foretells that a stock market crash could be ahead.
Margin Debt Continues to Soar
But this isn’t the only indicator suggesting that a stock market crash could be ahead.
Pay attention to the margin debt as well. This is essentially the amount of money borrowed to buy stocks. In March, margin debt on the New York Stock Exchange (NYSE) stood at $536.92 million. This is the highest amount ever recorded. (Source: “Securities market credit,” Intercontinental Exchange, Inc., last accessed May 25, 2017.)
You see, margin debt is one of the best indicators of investor optimism, and ultimately an indicator of an upcoming stock market crash. Just prior to the previous stock market crash, in 2008–2009, we saw margin debt hit an all-time high as well.
Valuations Are Above Historical Average
Last, but not least, pay attention to valuations. They are currently beyond extended, when compared to historical averages.
Consider the cyclically adjusted price-to-earnings (CAPE) ratio of S&P 500. This is essentially the price-to-earnings ratio of the index adjusted for price changes and cyclicality. The S&P 500’s CAPE ratio stands at 29.19. The last time the ratio was this high was back in 2002. (Source: “U.S. Stock Markets 1871-Present and CAPE Ratio,” Yale University, last accessed May 25, 2017.)
The long-term average of the CAPE ratio is 16.75. So, looking at this, one could say that the S&P 500 is 74% above its historical average.
On this topic, just remember one term: “mean reversion.” It refers to the fact that asset prices tend to eventually return to their average. If the S&P 500 returns back to its historical average, it would have to drop significantly. In the 2008–2009 stock market crash, the S&P 500 did come close to its historical average, but it happened after it had already declined by roughly 50%.
Where’s the Stock Market Headed Next?
Dear reader, understand one thing: as it stands, investor sentiment is calling for higher key stock indices. But know that this sentiment can change in a very short period.
Pay attention to the fundamentals and the indicators. They are suggesting that a stock market crash is a likely scenario in 2017. Yes, this is a very unpopular opinion these days, but completely ruling it out would be a big mistake.
How low could the S&P 500 go in the case of a stock market crash? Don’t be shocked if we see 25%–30% losses in a very short period. It’s important to keep in mind that, in times of panic, investors run for the exits and they oversell.