Silver Price Rally Time
The silver price slid following the surprise results from the U.S. presidential election. This initial response was to the upside, but that enthusiasm for the silver and precious metals complex quickly dwindled, and a significant sell-off quickly ensued. The good news is that there are increasing indicators that the selling has concluded, and that a significant rally will propel the silver price higher.
Precious metal investors have a special affinity for silver, and some circles dub silver as “the poor man’s gold.” The most intriguing factor surrounding this metal is its correlation to the gold price. These two metals are married at the hip, but with one caveat: the silver price tends to dramatically outperform gold when a rally in the precious metals space ensues. If gold is set to rise, then the silver price will undoubtedly follow, with much more vigor.
Advertisement

In one of our previous publications, “Perfect Ingredients for a U.S. Dollar Crash,” we outlined that the U.S. dollar sits in a precarious situation that increases the odds of a selling event gripping the dollar and driving it lower. A lower U.S. dollar price would translate into higher precious metal prices. This could come at a time when technical indicators from the silver price chart support the notion of a higher silver price.
The use of technical price patterns to discern trends and forecast future prices is known as technical analysis. The rules set out by this method of investment analysis are implying that the technical indicators and price patterns now apparent on the silver price chart are suggesting that a rally is likely to ensue.
The following silver price chart illustrates the price pattern that is suggesting that higher prices are a likely outcome.
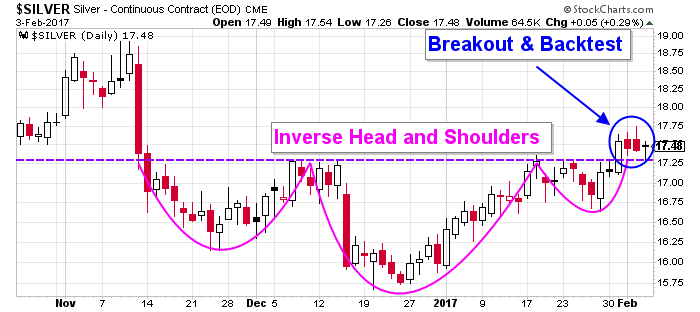
Chart courtesy of StockCharts.com
A technical pattern that is referred to by traders as an “inverse head and shoulders” pattern has developed on the silver price chart. This pattern is suggesting that the selling in this precious metal has concluded, and that a higher silver price is likely to follow.
An inverse head and shoulders pattern consists of three troughs and a neckline, where the middle trough (the head) is the largest, and the first and third troughs (the shoulders) are usually of equal size. The neckline is formed by connecting the reaction highs. The pattern is completed when the price closes above the neckline and indicates that a trend reversal is at hand.
This pattern is instrumental in providing the direction of the next move, as well as providing a potential price objective for that move. The theory surrounding this pattern states that a price objective can be obtained by taking the depth of the head and extrapolating that value above the neckline that completed the pattern. Using this theory on the pattern that is illustrated in the above chart creates a potential price objective of $18.90.
The price action that followed the successful breakout of the inverse head and shoulders pattern is a textbook example of a price returning to test a previous level of resistance from above. This price action is what traders refer to as a “backtest,” and it serves to reaffirm the notion that the breakout was legitimate. It is common for a price to accelerate in the direction suggested by the pattern after a successful backtest has been performed.
The following silver price chart illustrates an indicator that is also suggesting the notion that higher prices are likely.
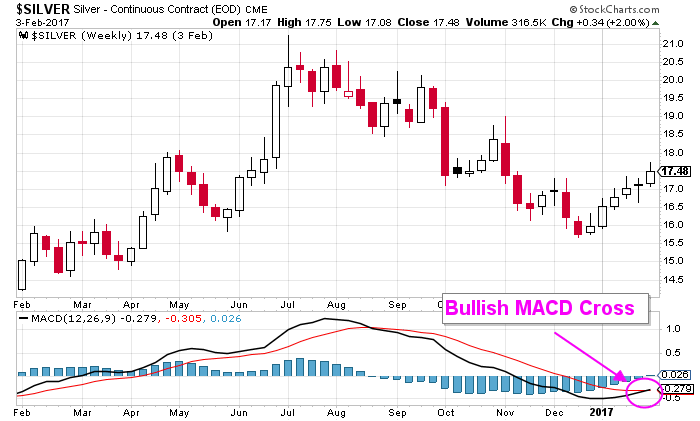
Chart courtesy of StockCharts.com
The moving average convergence/divergence (MACD) indicator in the lower panel of the above chart has just crossed in a bullish manner. MACD is trend-following indicator that uses signal-line crossings to distinguish between bullish and bearish momentum. The bullish cross that was just generated suggests that bullish momentum will influence the silver price and, as a result, higher prices should be expected.
In a trading environment, when this signal is engaged in a bullish manner, traders apply strategies geared toward a bullish outcome, because the signal implies that this is the direction of least resistance.
Bottom Line on the Silver Price
The confluence of bullish indicators and constructive price action serves to suggest and confirm that a bullish outcome is a real possibility for the silver price. Add the prospects of a weaker U.S. dollar, and these factors create the perfect ingredients that send this precious metal soaring.